Tutorial
Content
Tutorial
Content
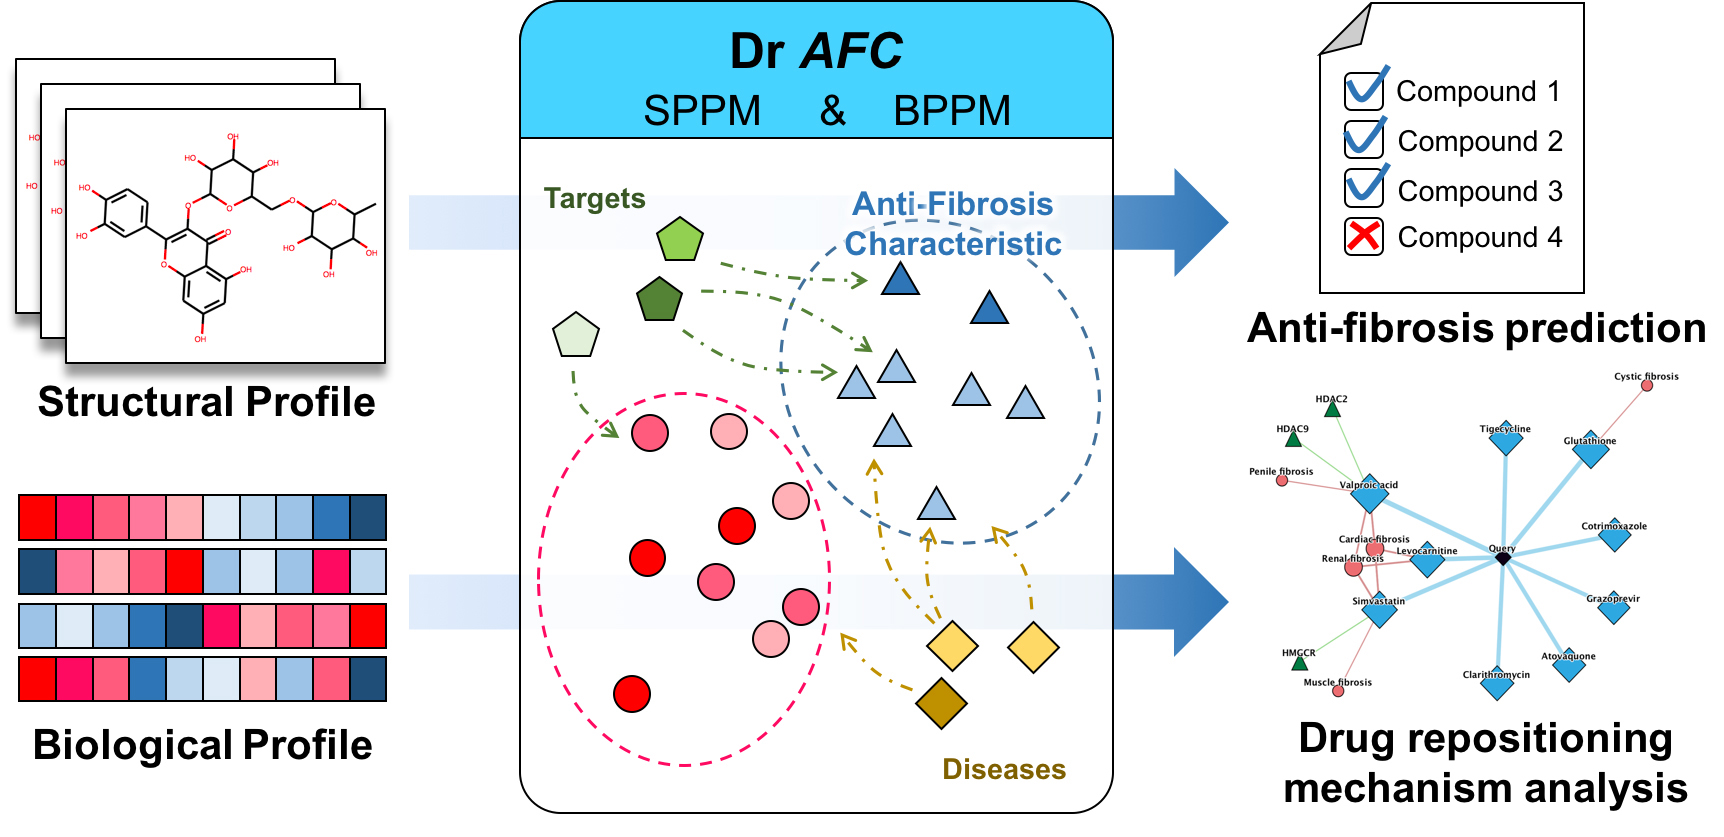
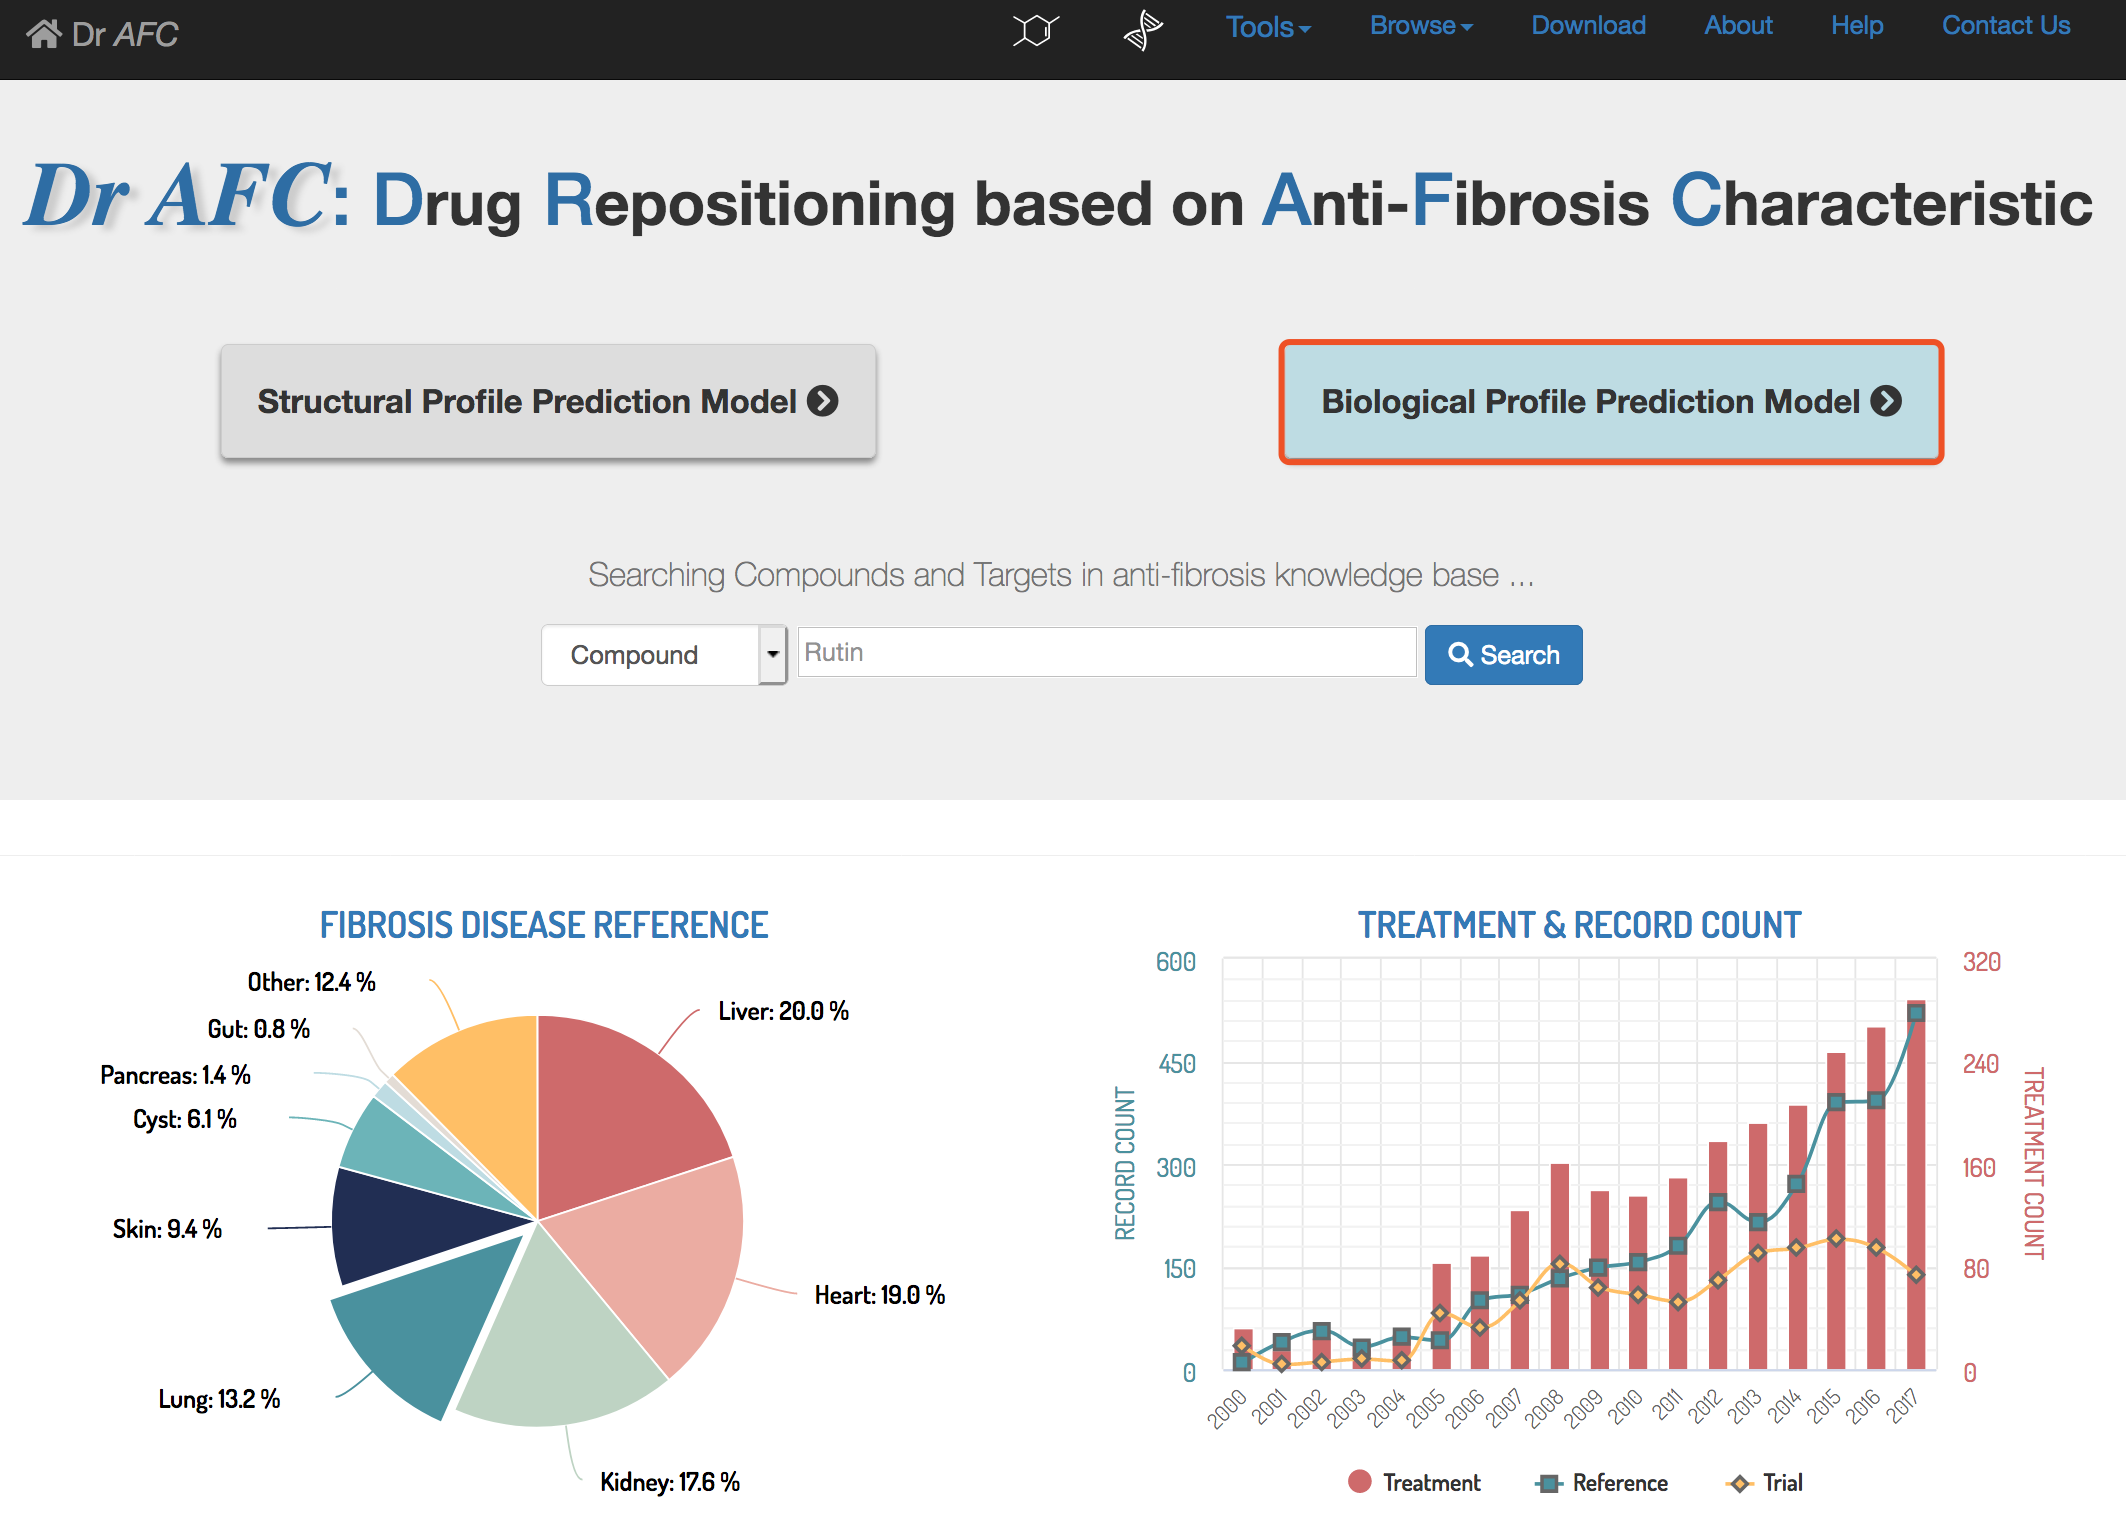
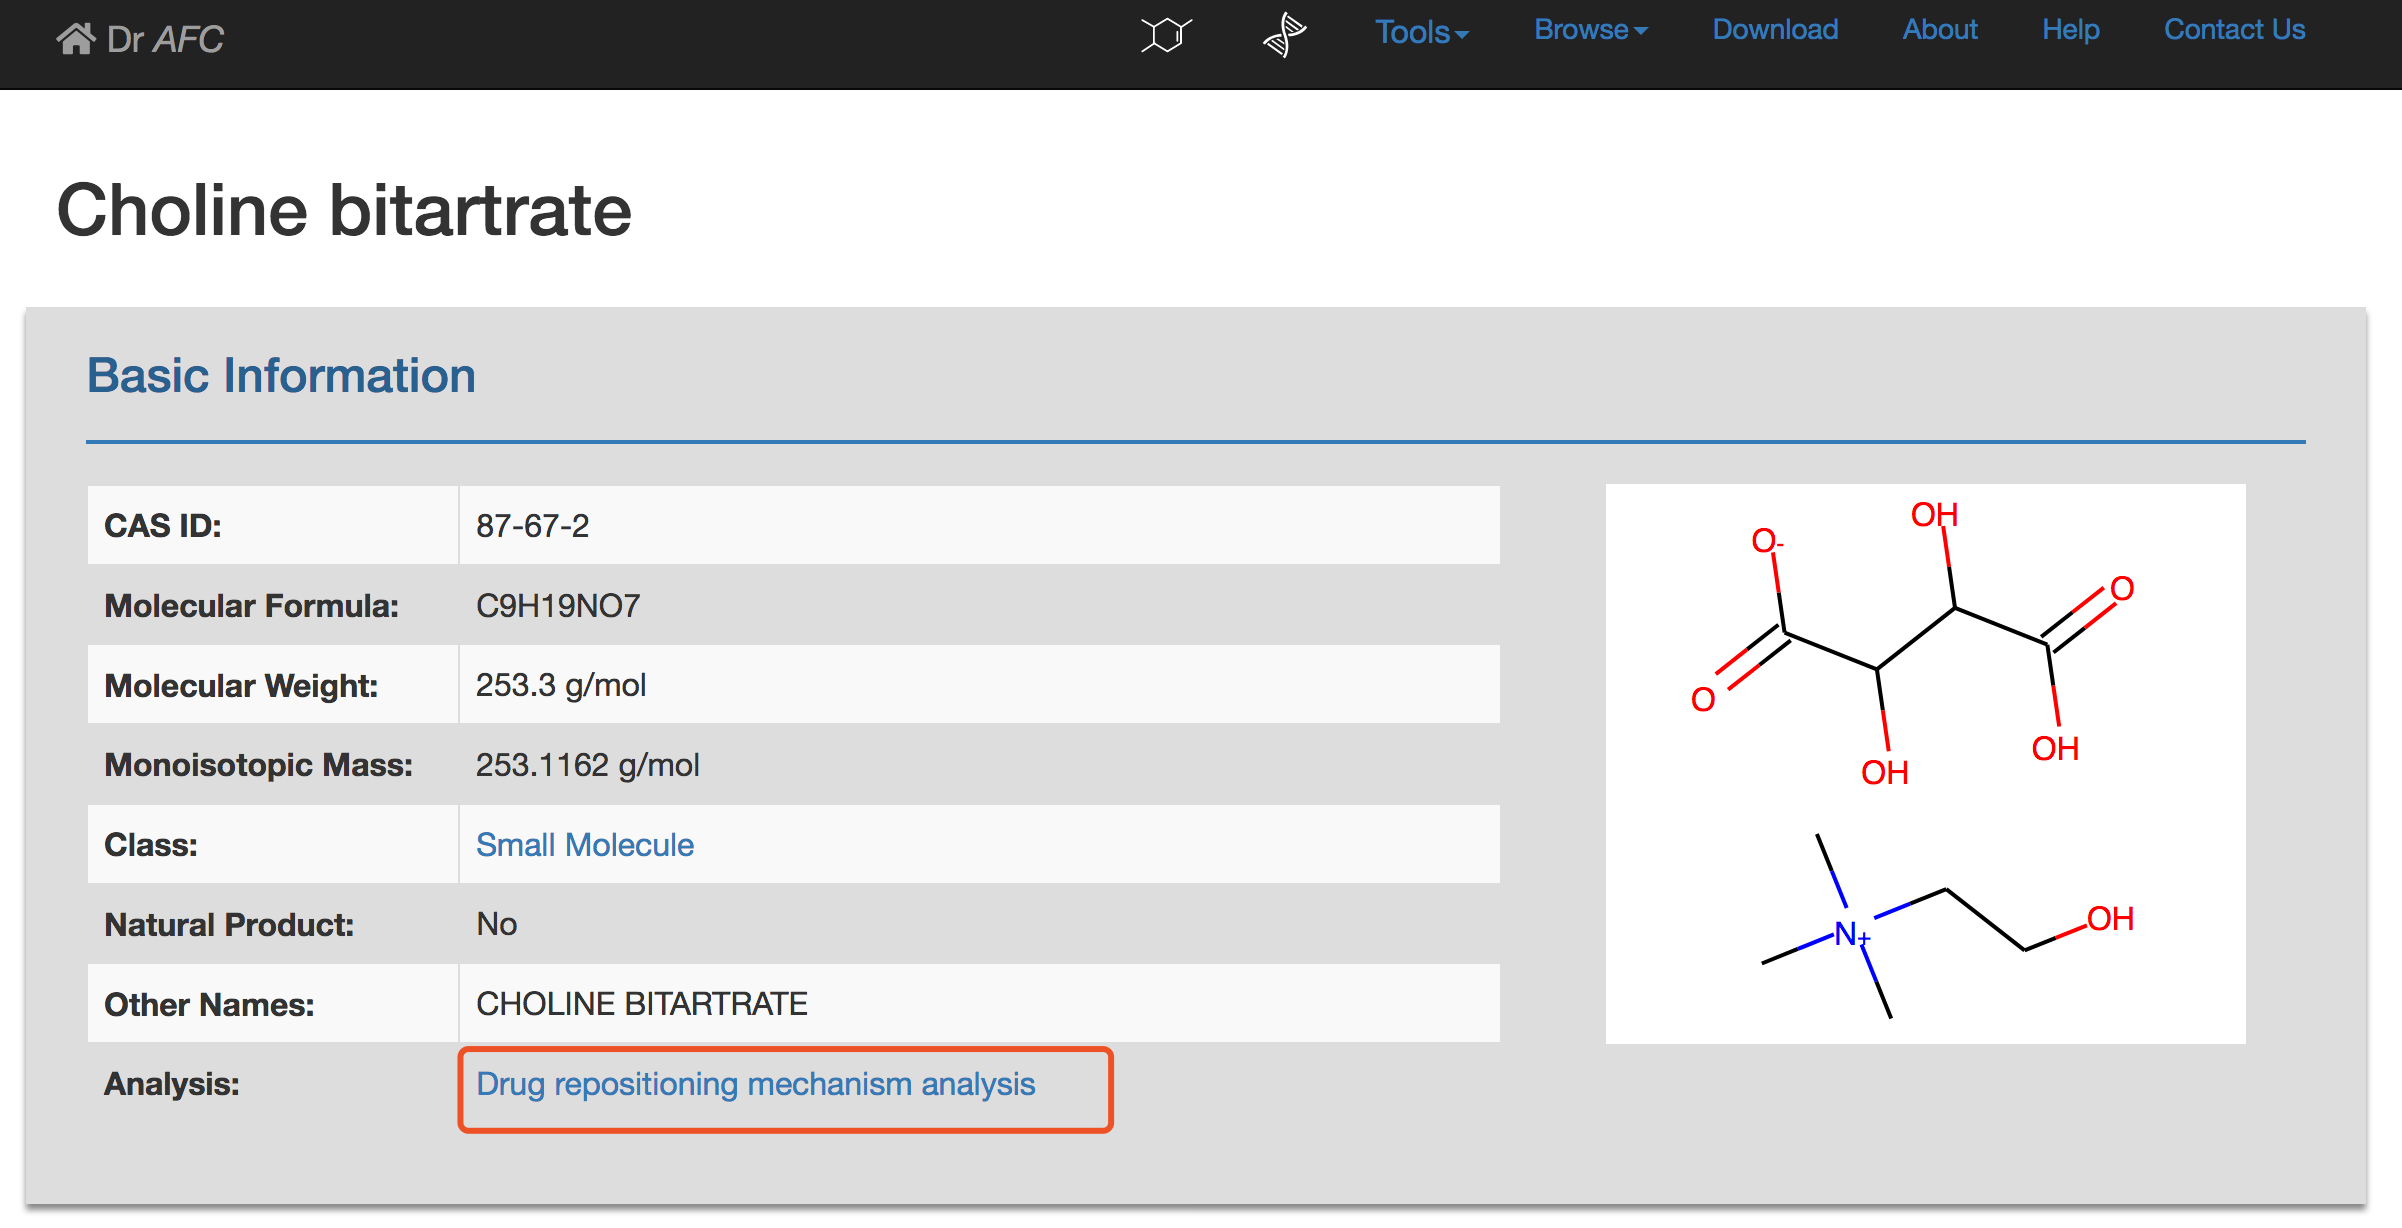
Dr AFC (https://www.biosino.org/drafc/) is a comprehensive, freely accessible platform aimed for Drug Repositioning that is based on anti-fibrosis characteristic and a virtual Knowledge Base accommodating anti-fibrosis compounds, targets and their interactions. (Figure 1). Dr AFC provides two main functions, anti-fibrosis prediction and drug repositioning mechanism analysis. Through Dr AFC platform, anti-fibrosis and potential repositioning could be predicted from compound structures and/or biological profiles. Drug repositioning mechanism analysis could infer the relationships among compounds, fibrosis-related targets and fibrotic diseases which help researchers understand pathology. Furthermore, druglikeness estimation, chemical similarity calculation and structure matching were integrated into Dr AFC to provide more useful information for drug development.
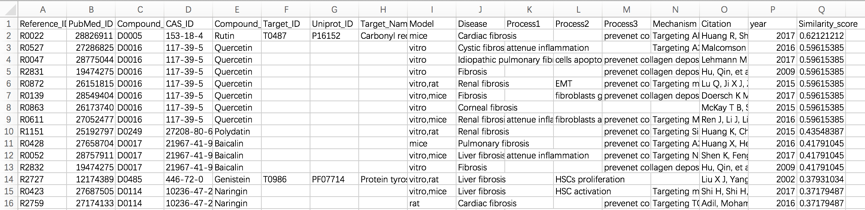
Dr AFC constructed the Anti-fibrosis Knowledge Base based on anti-fibrosis related literatures and clinical trials. Literatures from PubMed were collected through the key word “fibrosis AND target” in PubMed from Jan. 1st, 2000 to Oct. 31st, 2019. Literatures from Comparative Toxicogenomics Database (CTD)[1] were collected through the disease category “fibrosis” from Jan. 1st, 2000 to Oct. 31st, 2019. Clinical trials from ClinicalTrials.gov[2] were collected through the key word “fibrosis” from Jan. 1st, 2000 to Oct. 31st, 2019. In addition, approved anti-fibrosis drugs from DrugBank (Version 5.1.3) [3] were collected. Anti-fibrosis treatments, fibrosis-related targets and compound-target information were extracted from collected literatures and trials. Statistics of all items are shown below (Table 1).
Table 1. The numbers of Dr AFC records.
Type | Counts |
Anti-fibrosis Treatments | 1223 |
Fibrosis-related Targets | 1067 |
Fibrosis-related References | 3096 |
Fibrosis-related ClinicalTrials | 1787 |
Fibrosis-related Compound-Target Interactions | 507 |
The SPPM of Dr AFC could calculate anti-fibrosis and repositioning score(S) using structural profile. The anti-fibrosis and repositioning score reflect the ability of a compound serving as a therapeutic treatment for fibrotic diseases. The model was constructed based on gradient boosting method. The optimal feature set used in modelling was selected by Iterative feature elimination (IFE) algorithm. SMILES strings of compounds would be submitted to SPPM and Dr AFC will return repositioning results accordingly.
1) Enter the SPPM page
From our homepage, click the Structural Profile Prediction Model to enter the SPPM submission page.

2) Submit compound structure
SPPM accepts compound structures in two ways and users can choose either of them.
A. Enter or paste compound name followed by its SMILES string in the input box. Compound name and its corresponding SMILES string should be separated by a Tab, comma or space character.
e.g. quercetin-4'-glucoside,C1=CC(=C(C=C1C2=C(C(=O)C3=C(C=C(C=C3O2)O)O)O)O)OC4C(C(C(C(O4)CO)O)O)O
Multiple compounds are also allowed, with each compound in a separate row.
B. Upload a file containing compound names followed by their SMILES strings. The file should have two columns, compound names and corresponding SMILES strings. The two columns should be separated by a Tab, comma or space character. File format could be .txt .csv or .xlsx. Example file could be downloaded by clicking the Example button.
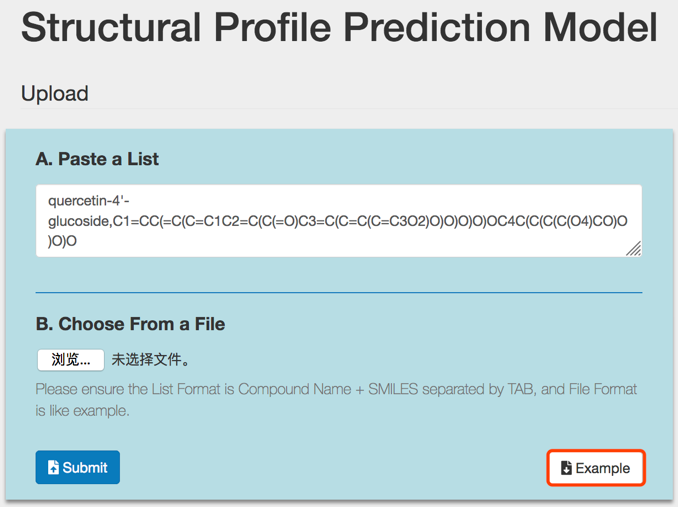
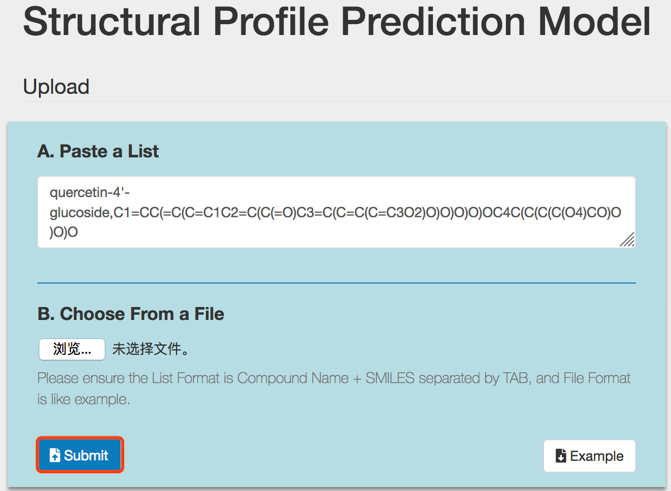
Click the Submit button to perform SPPM analysis.
Tip! Users should use only one way (A or B) to submit, otherwise Dr AFC will return an error warning.
3) SPPM analysis result
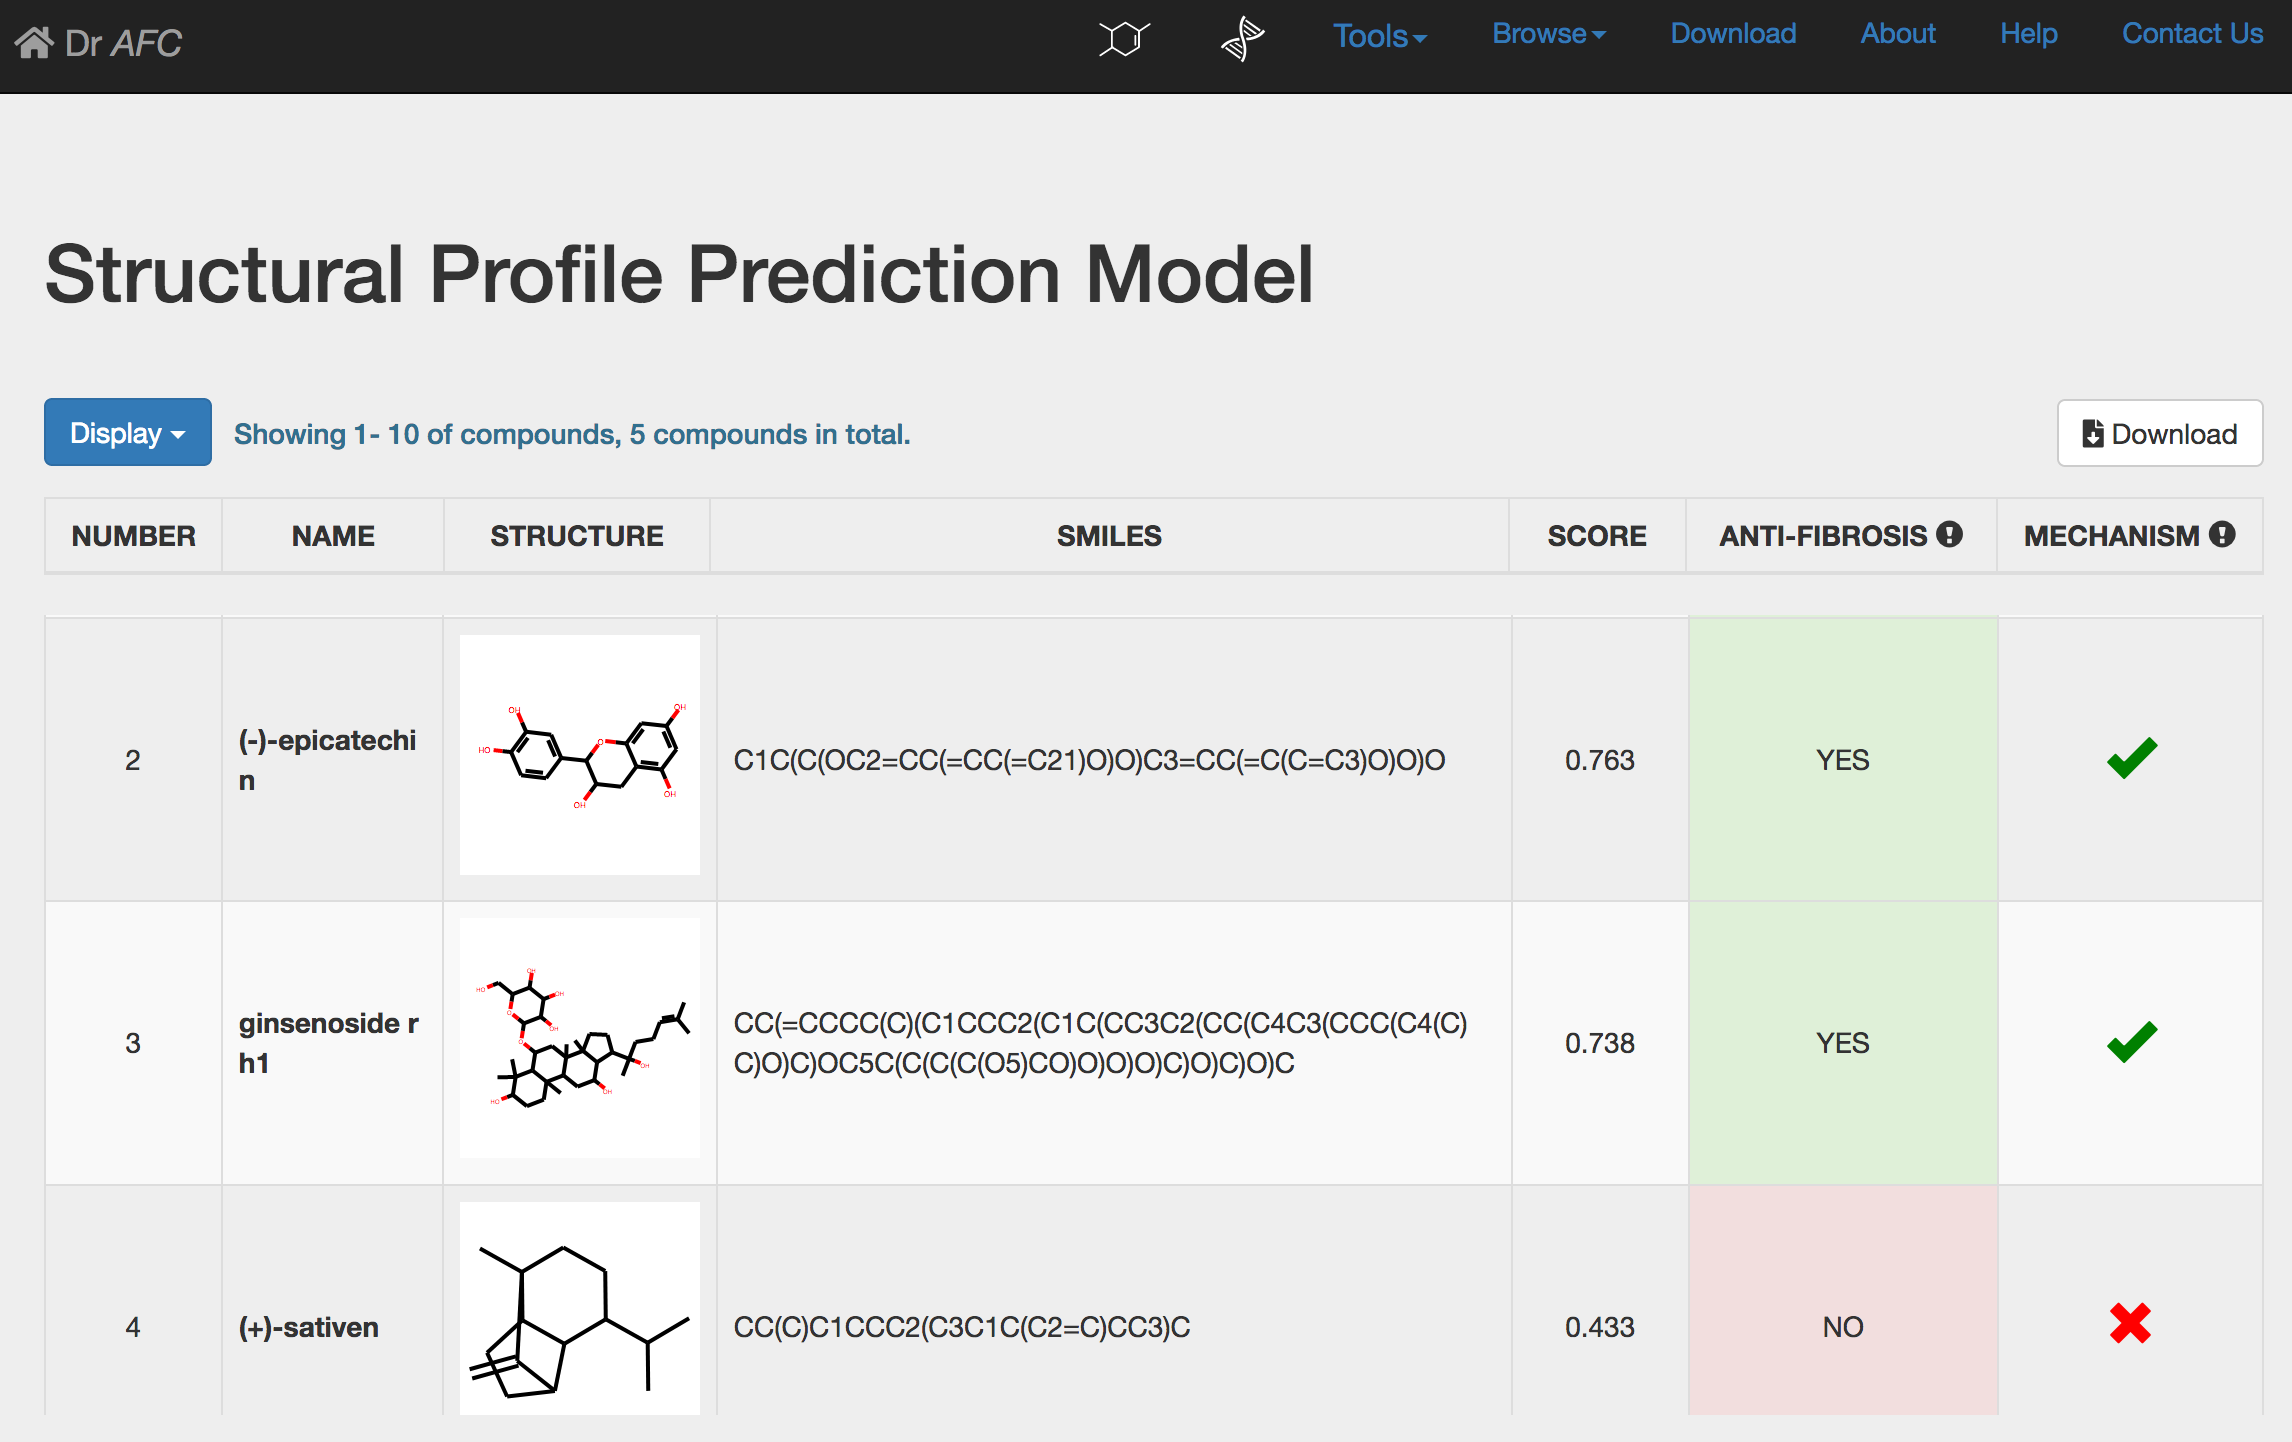
SPPM could automatically perform repositioning prediction and return a result page. The prediction result will be displayed in a seven-column table as following:
NUMBER: compound number.
NAME: compound name.
STRUCTURE: the 2D chemical structure generated by SMILES string. Users could click the picture to visualize the structure on a new page.
SCORE: anti-fibrosis and repositioning score(S) calculated by SPPM, ranging from 0 to 1. Higher score indicates stronger anti-fibrosis characteristic and repositioning potential.
ANTI-FIBROSIS: the anti-fibrosis status predicted by SPPM. Compounds with S > 0.5 would be defined as anti-fibrosis and labeled “YES”. Otherwise, compounds would be labeled as “NO”.
NAME: compound name.
MECHANISM: drug repositioning mechanism analysis. See section 4 for more information.
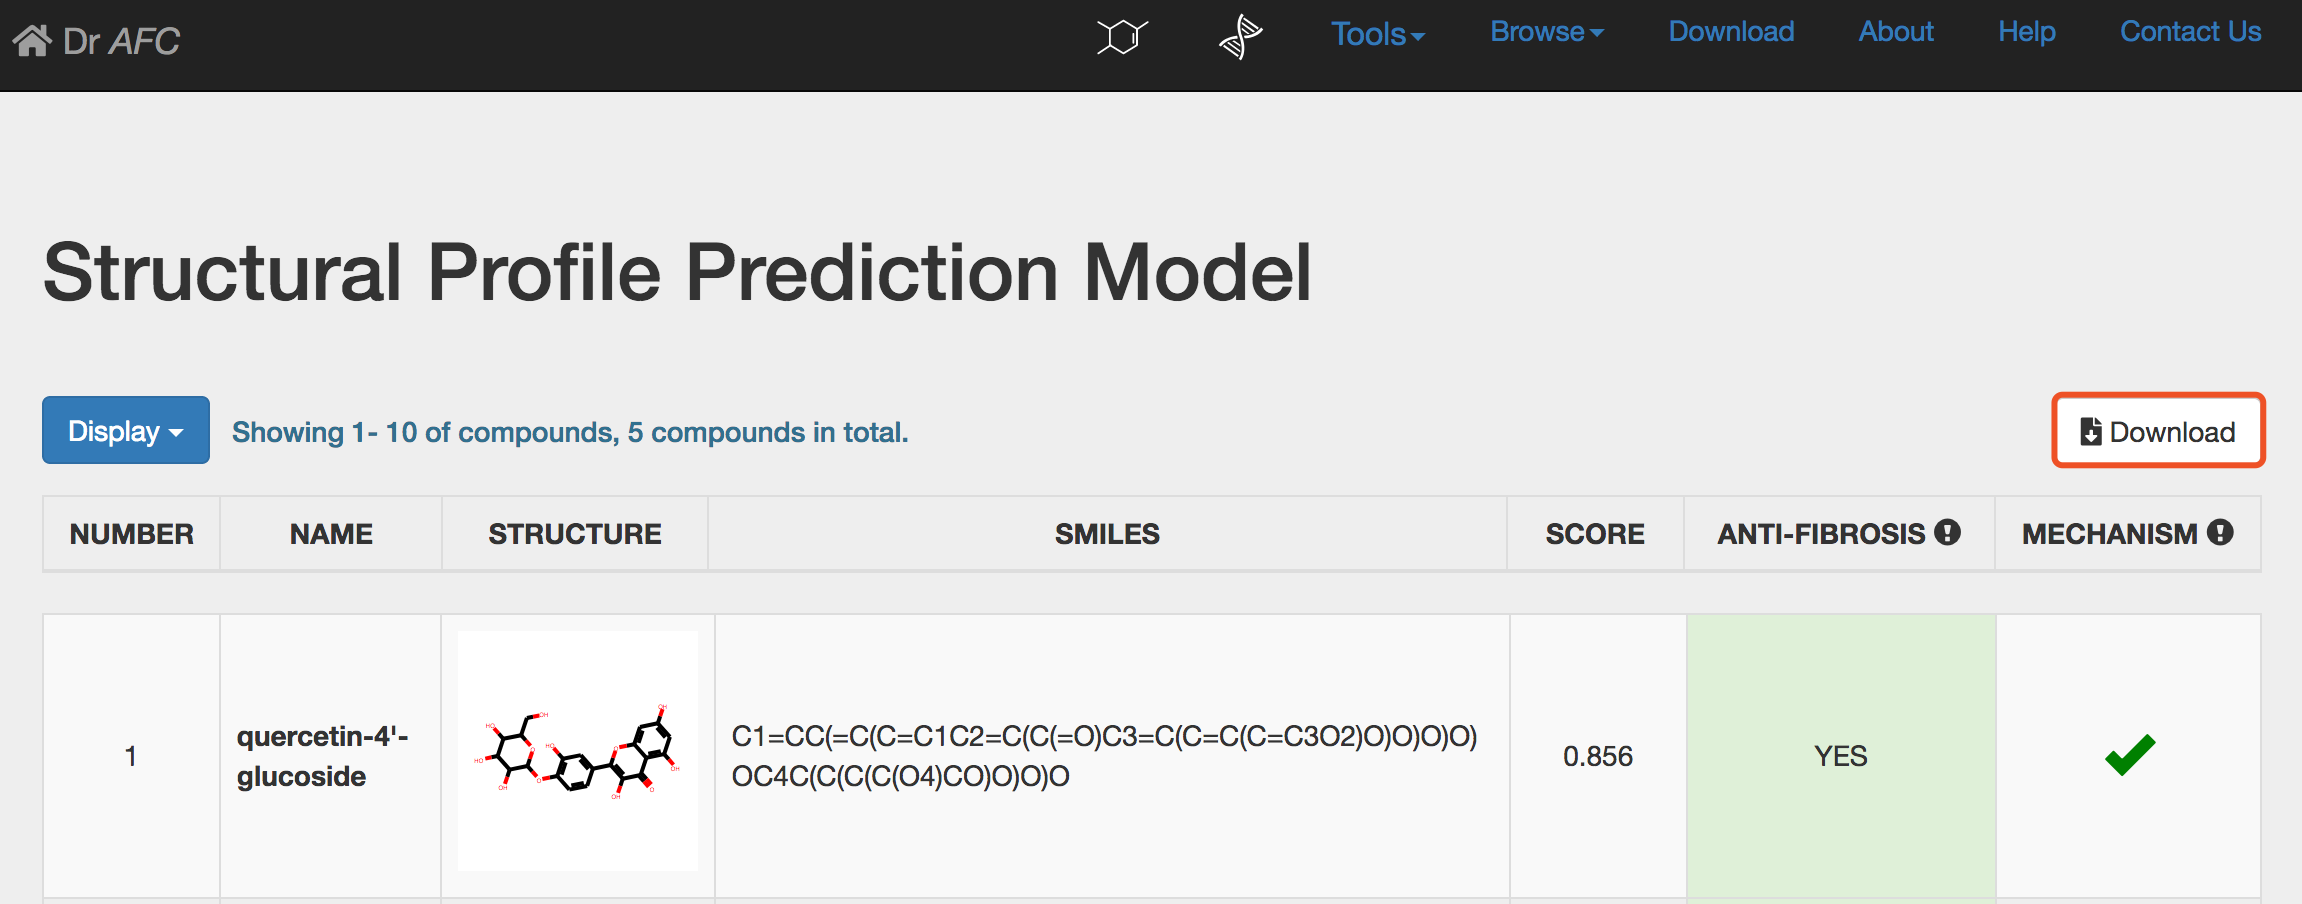
Users can display first 10, 50 or 100 compounds through setting the Display drop-down list.
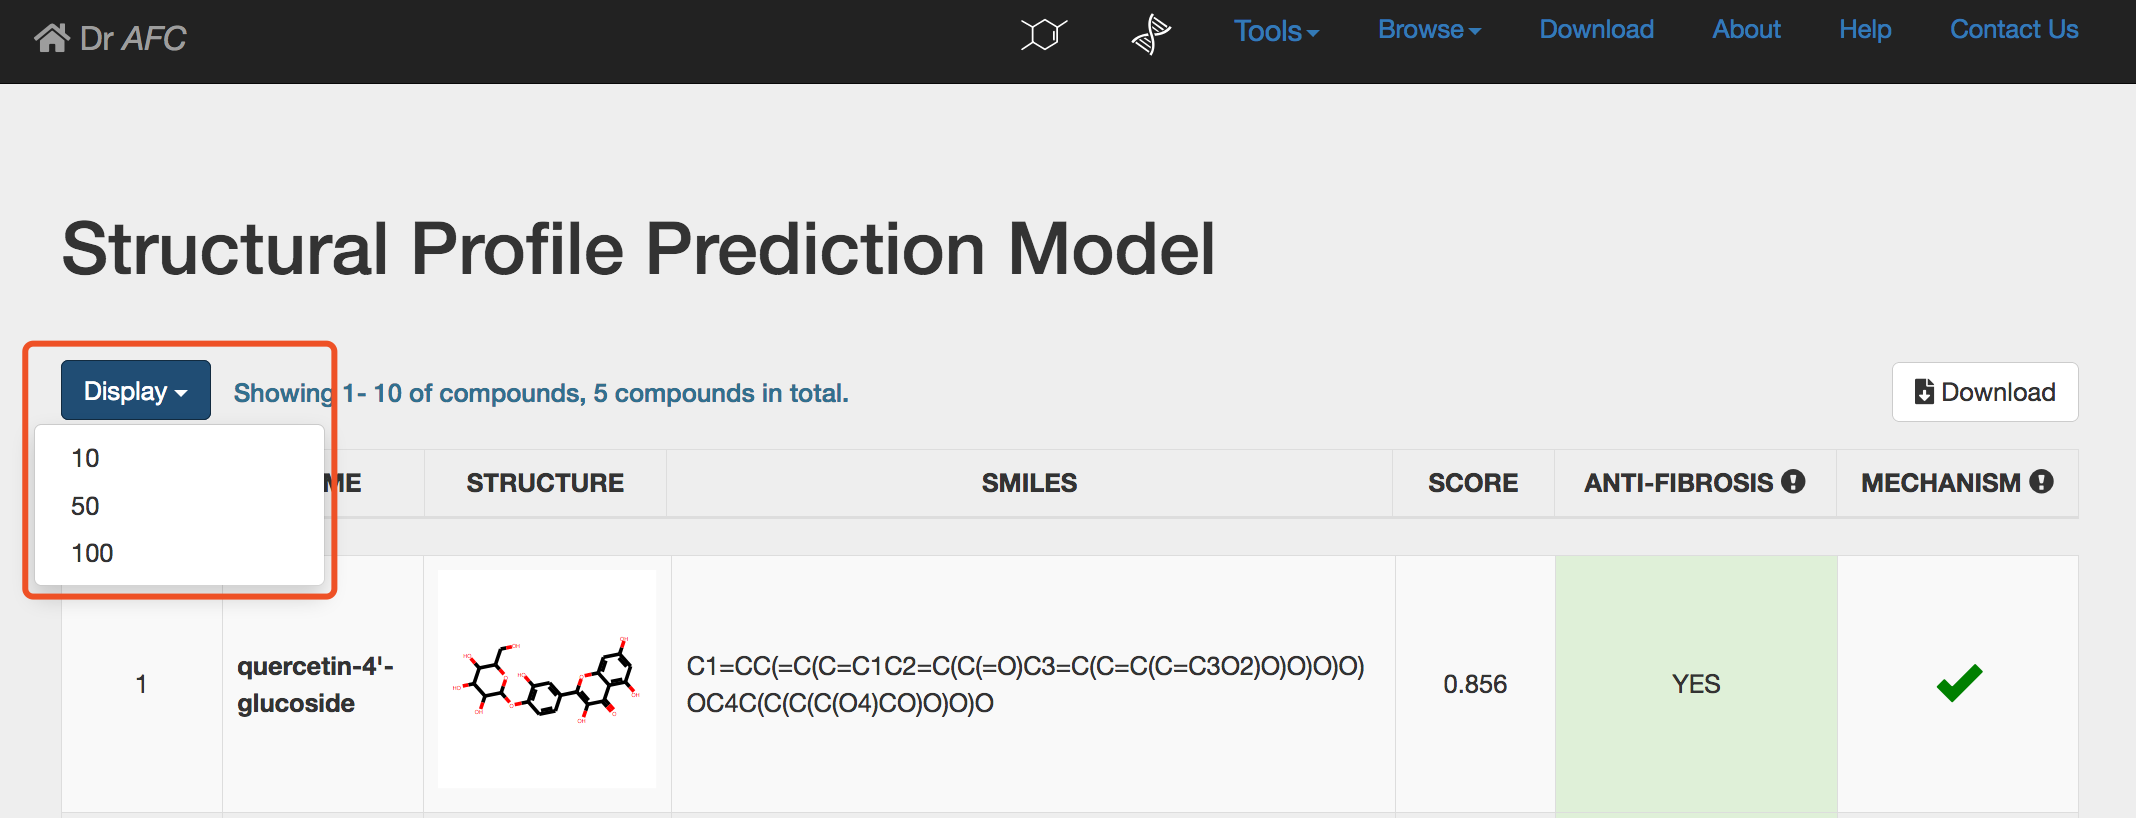
Click the Download button to download the entire prediction result table. The downloaded file is a tab separated text file.
If the study object of interest does not have a single SMILES string or direct structural information, such as a combination of drugs, BPPM of Dr AFC could be performed to predict their repositioning potential. BPPM could calculate anti-fibrosis and repositioning score(S) from biological profiles. The model was also constructed based on gradient boosting method and the optimal feature set used for modelling was selected by IFE algorithm. The compound-induced expression profiles could be submitted to the BPPM and Dr AFC will return repositioning results.
1) Enter the BPPM page
Similar to SPPM, click the Biological Profile Prediction Model to enter the BPPM submission page.
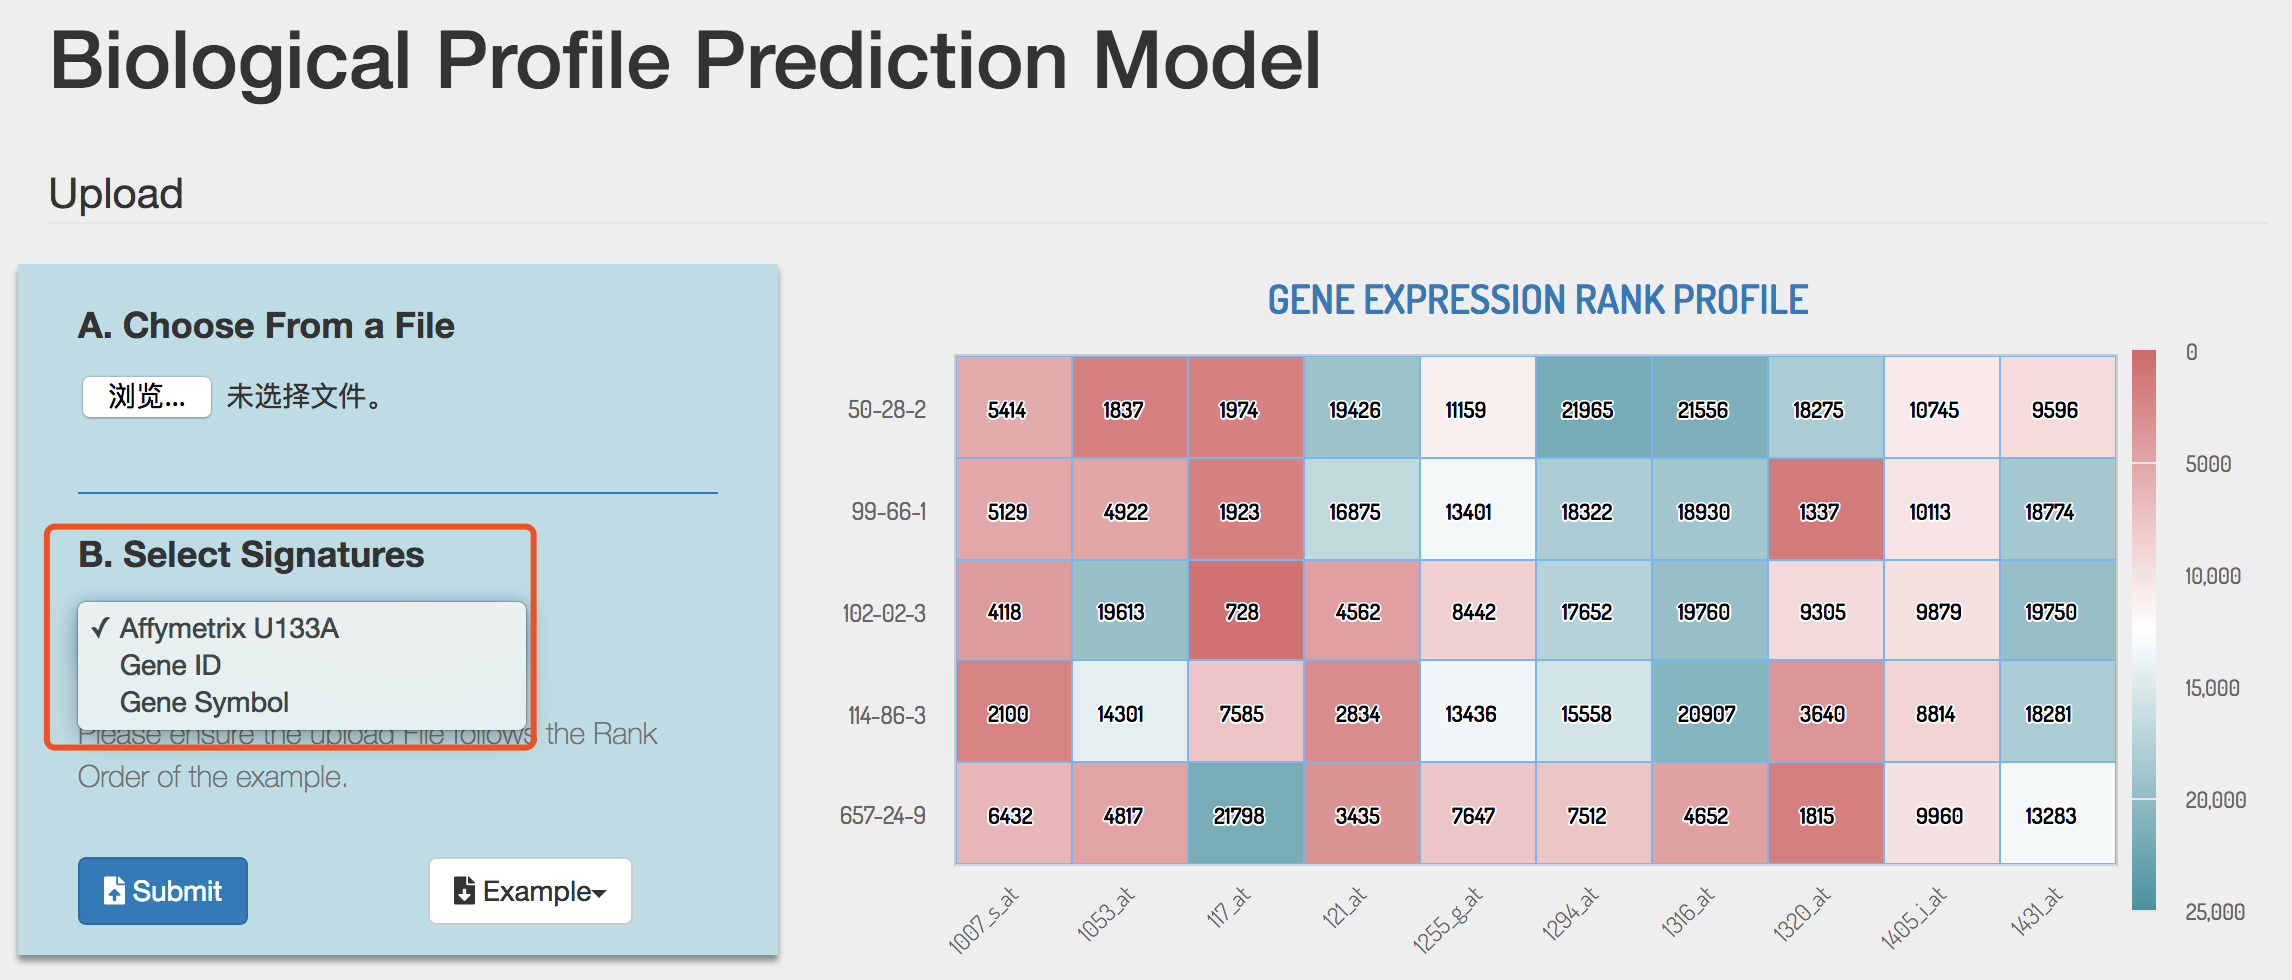
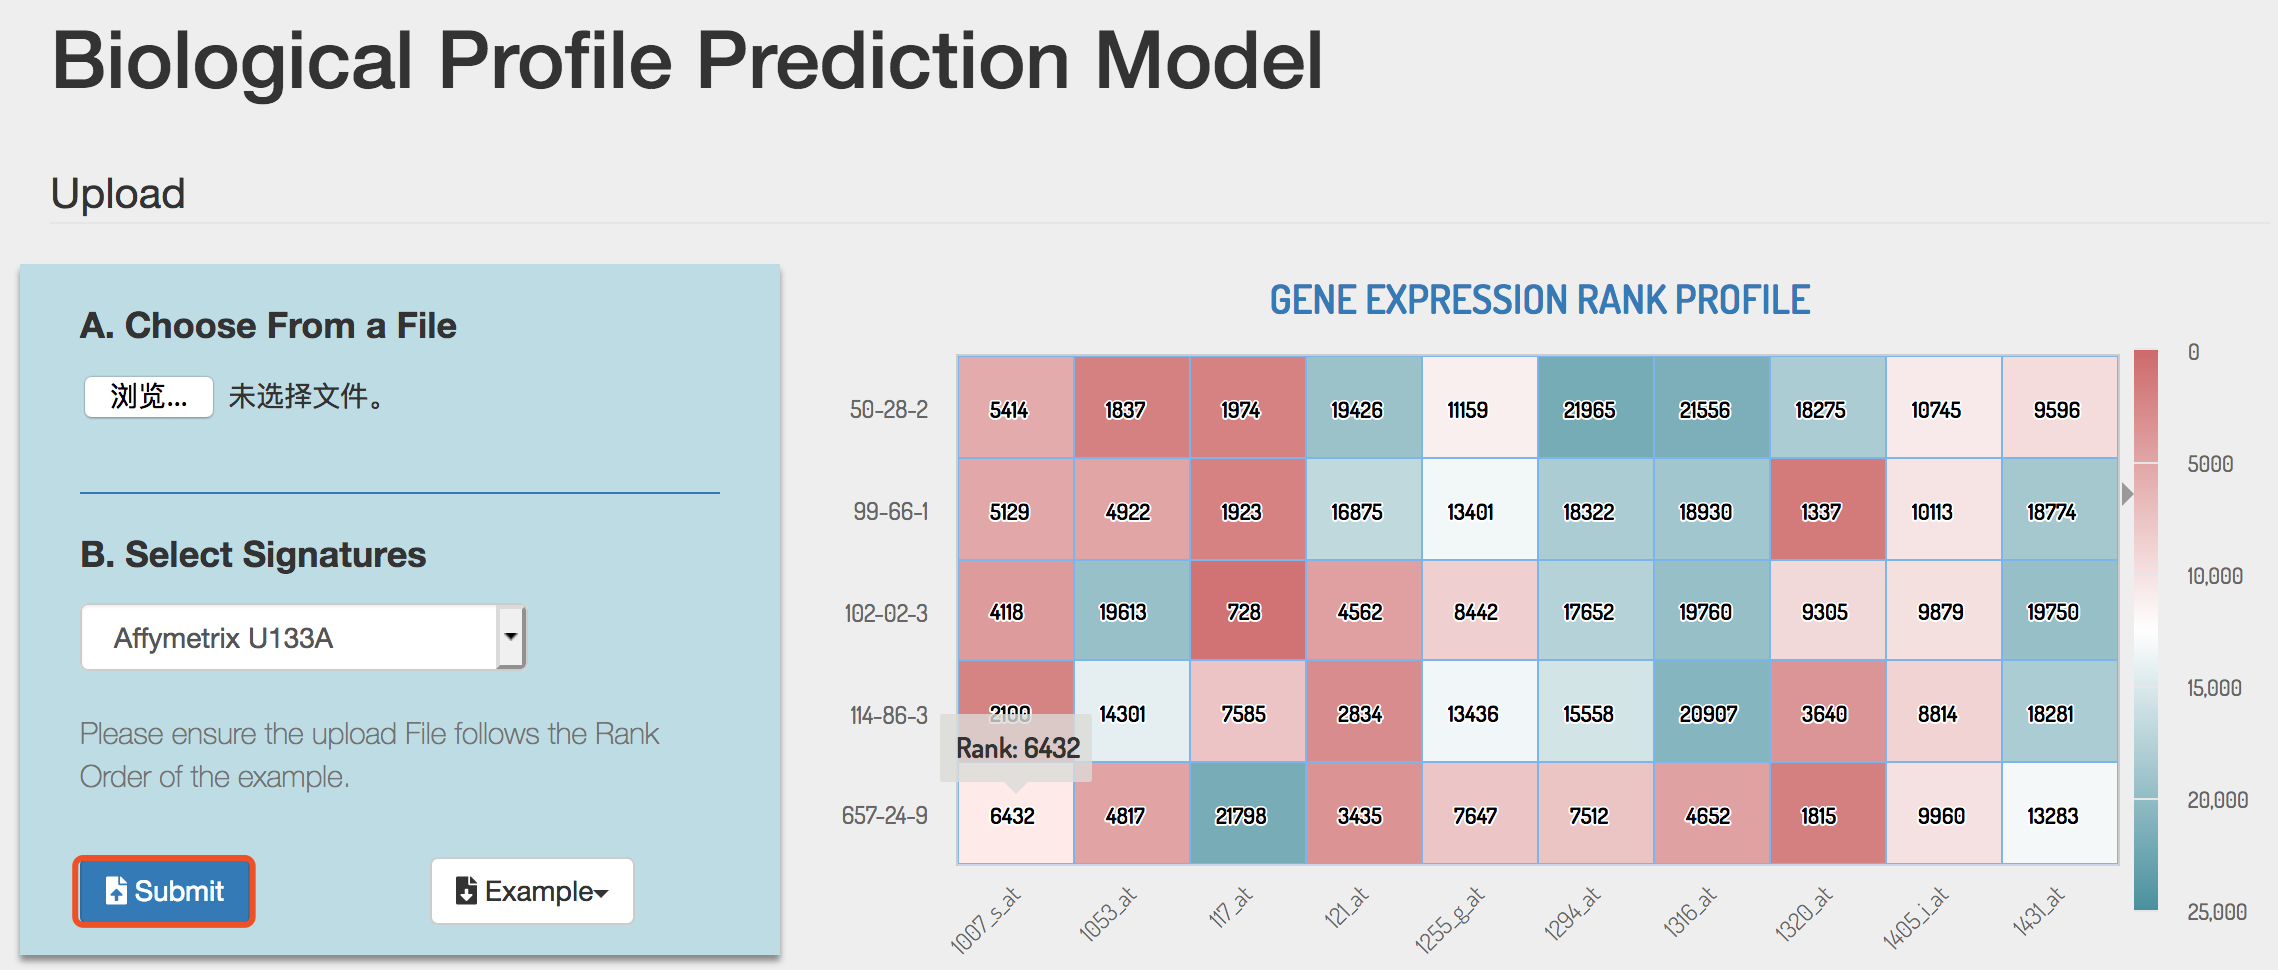
2) Submit biological profiles
BPPM only accepts files containing expression profiles. The file should contain compound-induced gene expressions with compound name as row name and gene name/probe ID as column name. Before submission, signature type should be specified as Affymetrix U133A ID, Gene ID or Gene symbol. Columns should be separated by Tab, comma or space character. The file format could be .txt .csv or .xlsx. Example file could be downloaded by clicking the Example button.
Tip! The order of signature by column in the uploaded file should match the order in the example.
Click the Submit button to perform BPPM analysis.
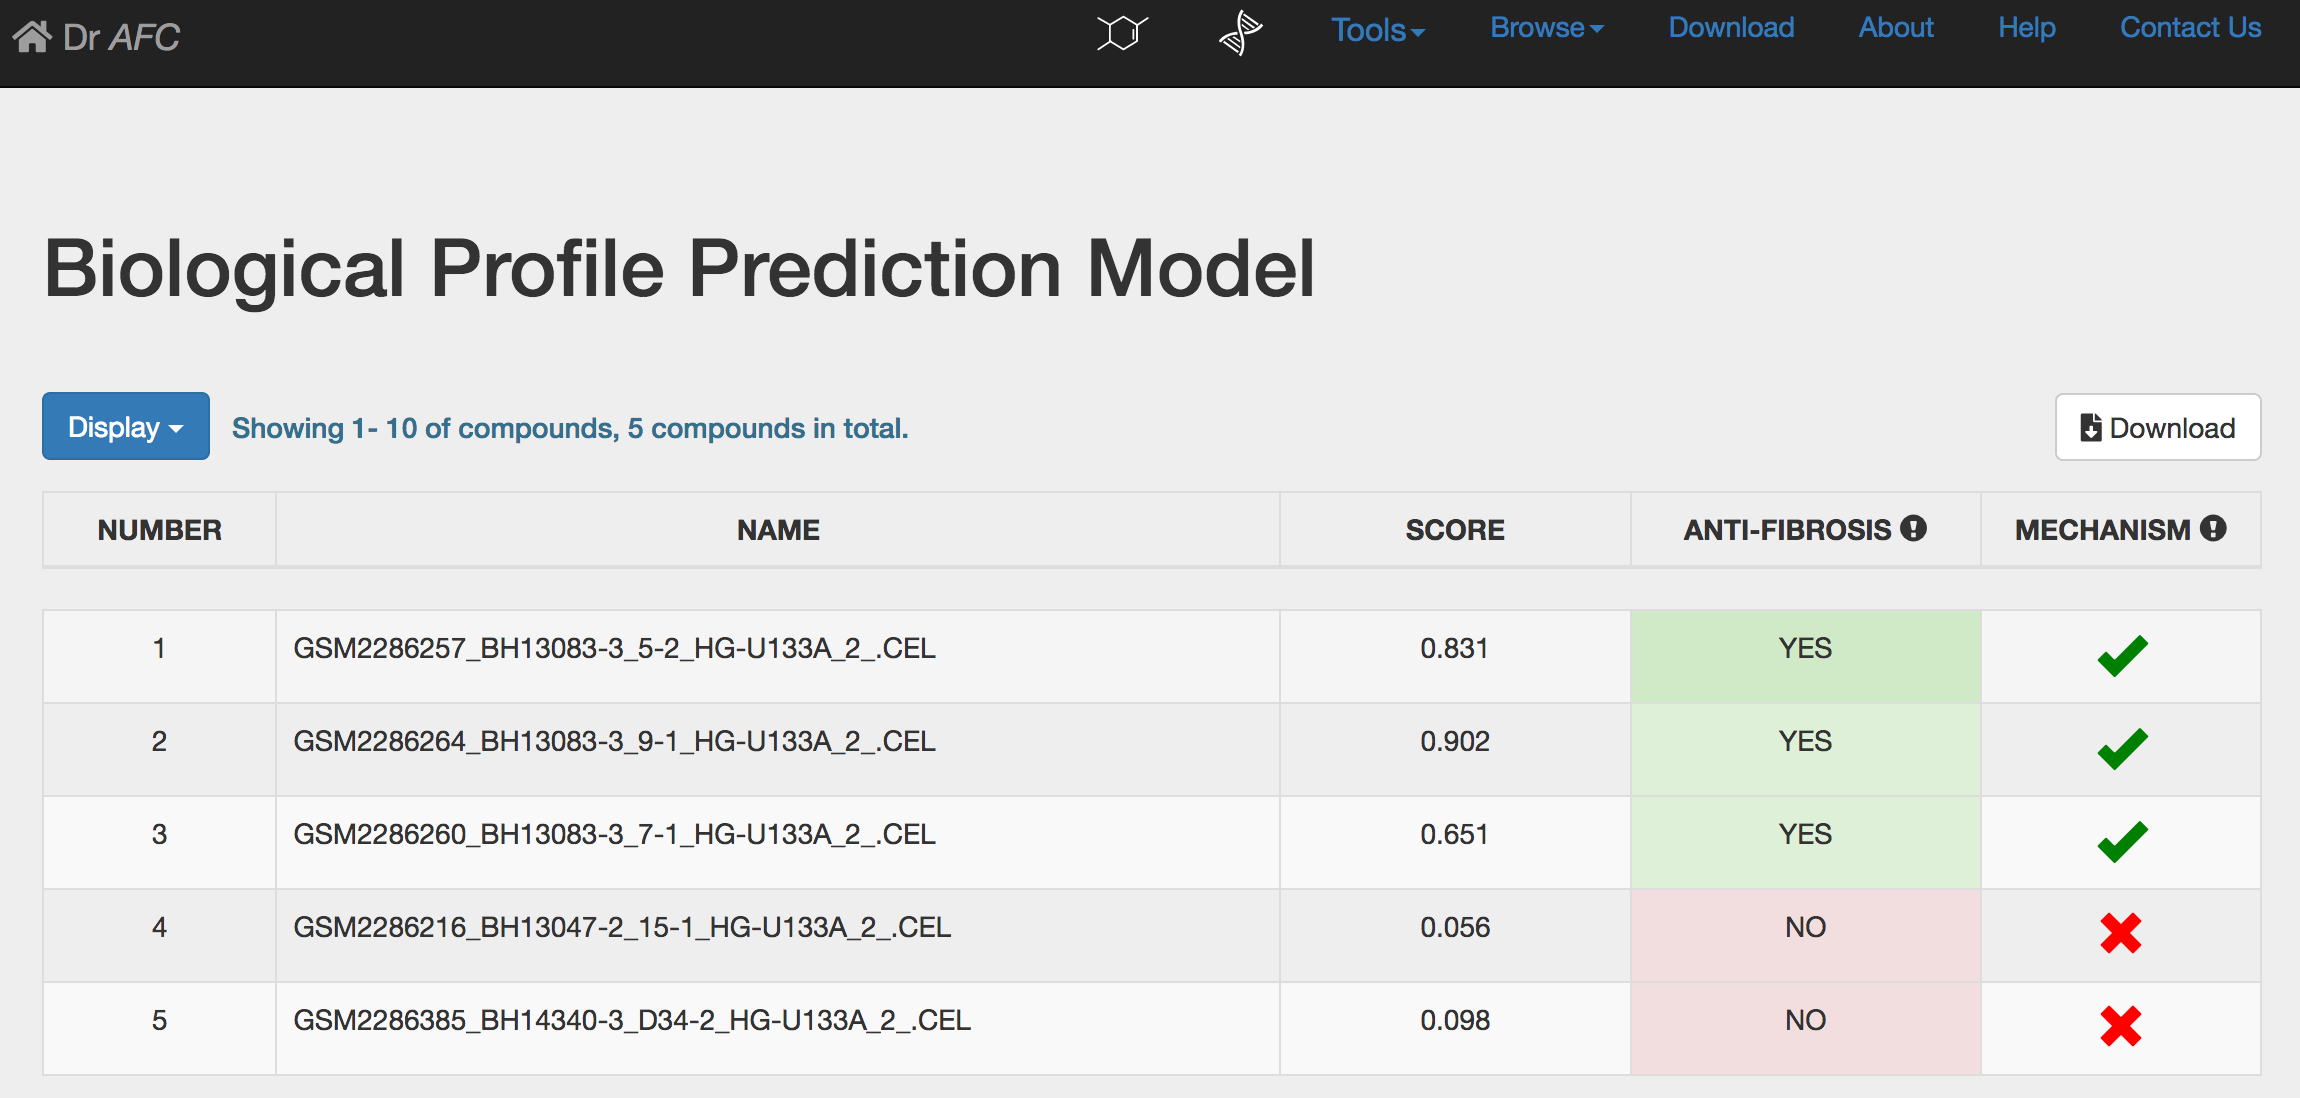
3) BPPM analysis result
BPPM could automatically perform repositioning prediction and return a result page. The prediction result will be displayed in a five-column table as following:
NUMBER: compound number.
NAME: compound name.
SCORE: anti-fibrosis and repositioning score(S) calculated by BPPM, ranging from 0 to 1. Higher score indicates stronger anti-fibrosis characteristic and repositioning potential.
ANTI-FIBROSIS: the anti-fibrosis status predicted by BPPM. Compounds with S > 0.5 would be defined as anti-fibrosis and potential repositioning compounds labeled as “YES”. Otherwise, compounds would be labeled as “NO”.
MECHANISM: drug repositioning mechanism analysis. See section 4 for more information.
Similar to the SPPM result page, BPPM result table can display first 10, 50 or 100 compounds through setting the Display drop-down list. Users could click the Download button to download the entire prediction result table. The downloaded file is a tab separated text file. Please see section 2 for reference.
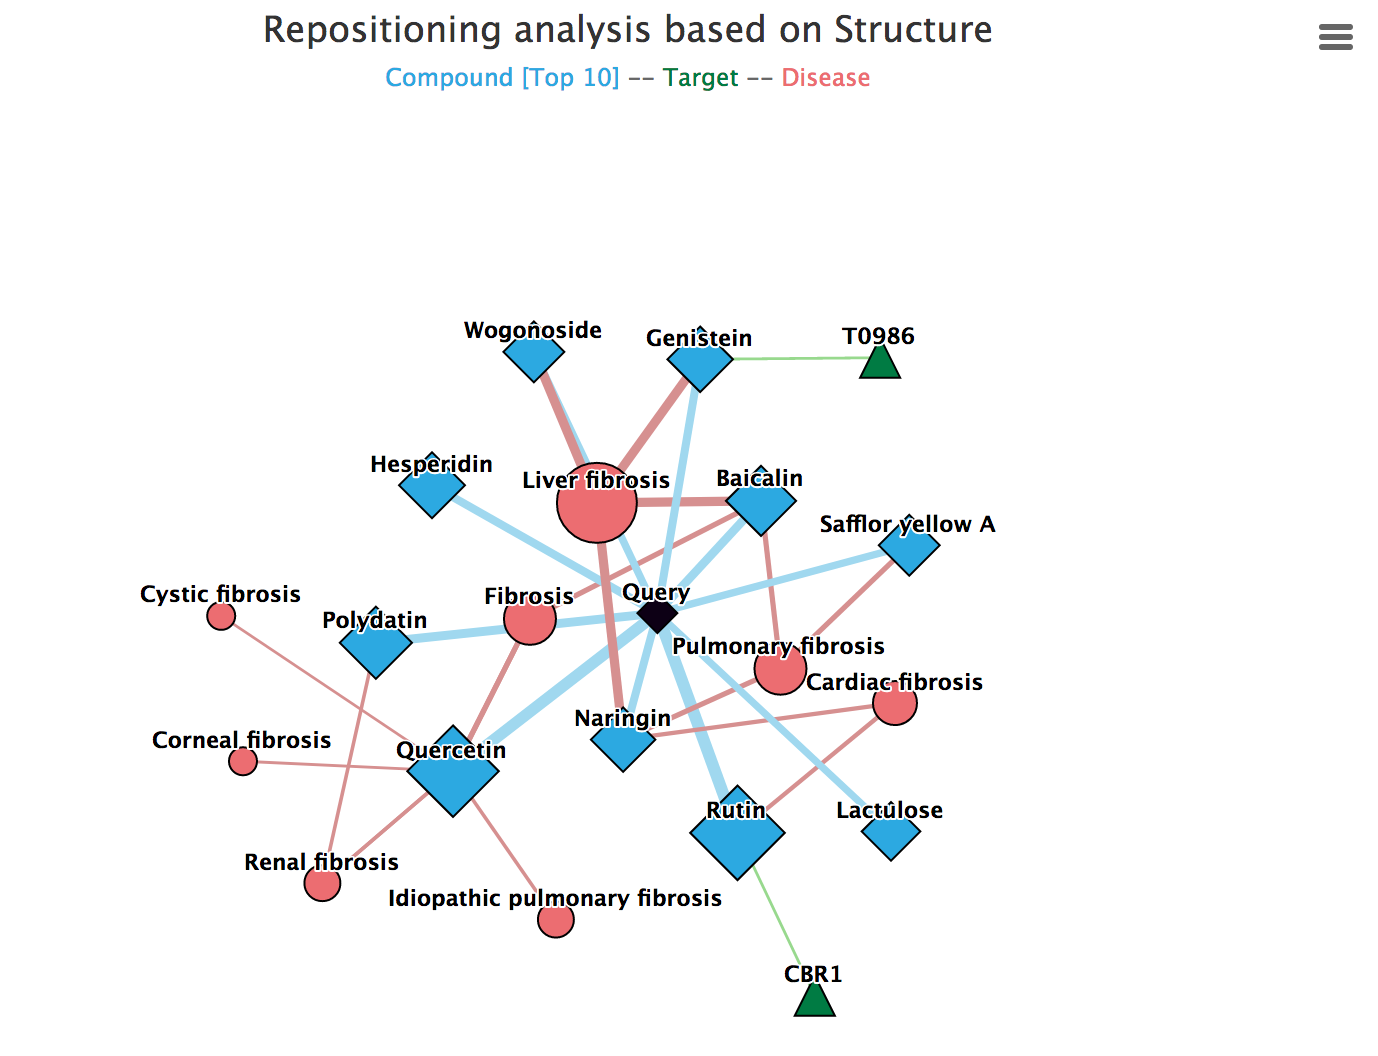
The Drug Repositioning Mechanism Analysis of Dr AFC could construct mechanism networks based on compound-target-disease corresponding information in the Anti-fibrosis Knowledge Base. Compounds that may interact with the same targets and diseases are predicted by calculating Tanimoto similarity on chemical structural fingerprints or calculating Spearman's rank correlation coefficient on biological profiles. Targets and disease information of compounds are extracted from the Anti-fibrosis Knowledge Base to explore the anti-fibrosis mechanism of compounds. The Drug Repositioning Mechanism Analysis displays potential mechanisms among compounds in compound-target-disease network to help discover feasible drug repositioning solutions.
1) Enter the Drug Repositioning Mechanism Analysis page
The Drug Repositioning Mechanism Analysis could be accessed via Compound page or SPPM/BPPM result pages.
A. Click the Drug repositioning mechanism analysis to enter the Drug Repositioning Mechanism Analysis page from compound page.
B. Click the ![]() button to enter the Drug Repositioning Mechanism Analysis page from SPPM/BPPM result pages.
button to enter the Drug Repositioning Mechanism Analysis page from SPPM/BPPM result pages.

2) Display Repositioning Network
In the Drug Repositioning Mechanism Analysis page, repositioning network is displayed on the left.
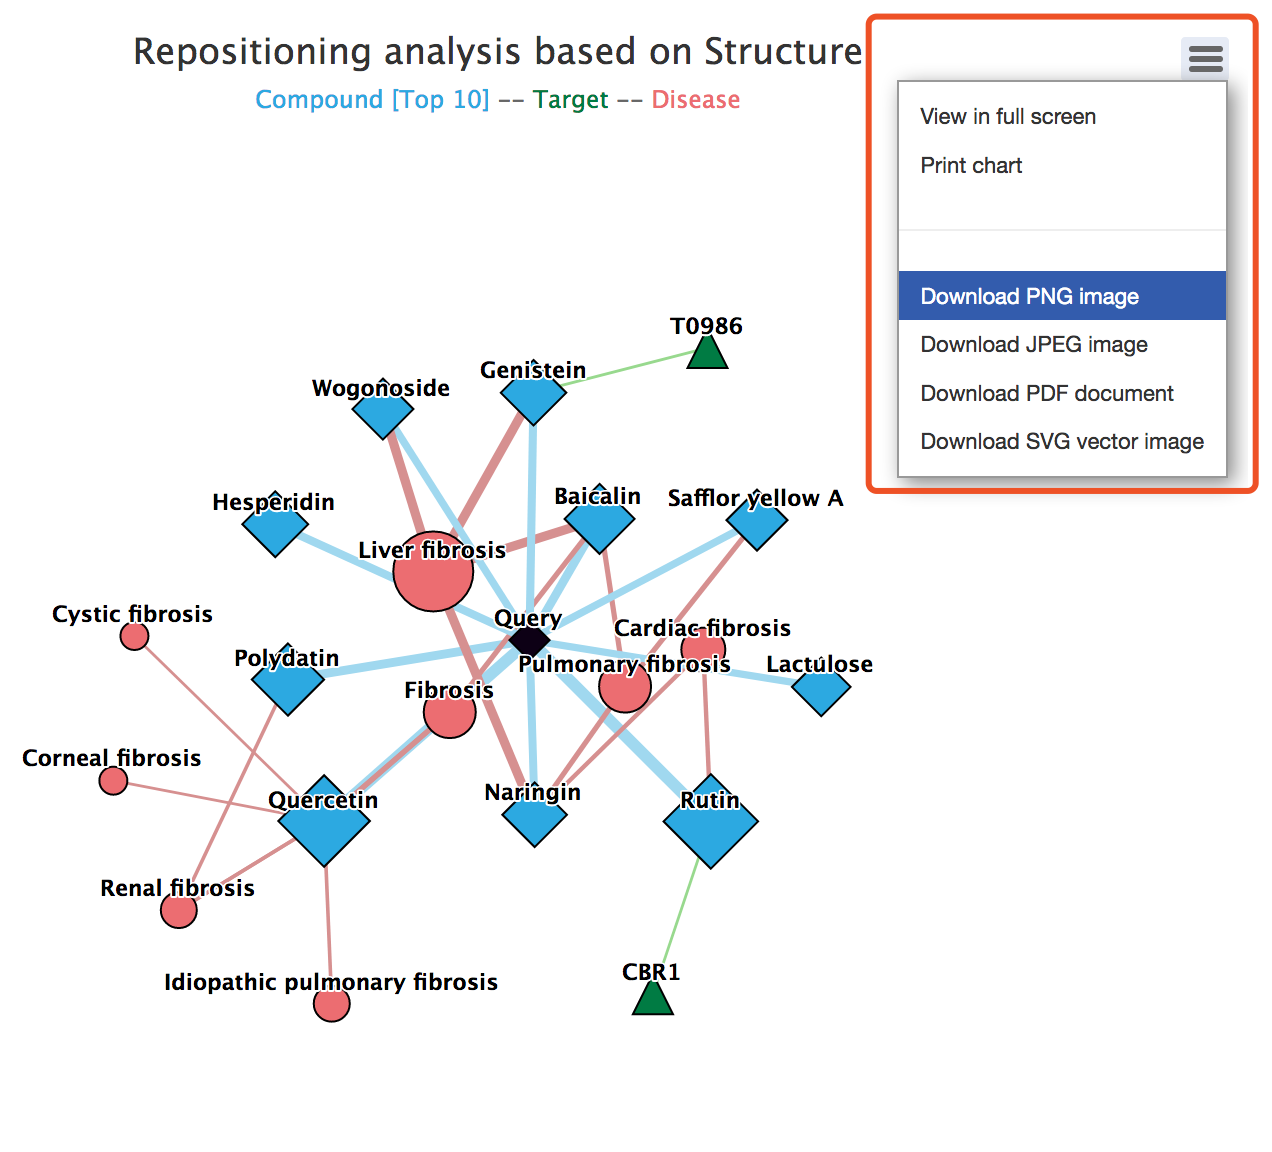
The network pictures the potential repositioning mechanism of a query compounds by connecting it with various relevant compounds, targets and diseases.
In the network, each node represents a compound, target or disease. The node size represents the weight, reflecting confidence of the relevance. For example, a larger Blue diamond node represent compound more similar to the query compound. Edges stand for the interactions between compound-compound, compound-target and compound-disease.
![]() Black diamond: the query compound in SPPM/BPPM result page.
Black diamond: the query compound in SPPM/BPPM result page.
![]() Blue diamond: compounds in the Anti-fibrosis Knowledge Base that are similar to the query compound according to Tanimoto similarity on chemical structural fingerprints or Spearman's rank correlation coefficient based on biological profiles.
Blue diamond: compounds in the Anti-fibrosis Knowledge Base that are similar to the query compound according to Tanimoto similarity on chemical structural fingerprints or Spearman's rank correlation coefficient based on biological profiles.
![]() Green triangle: targets of compounds in the network.
Green triangle: targets of compounds in the network.
![]() Red round: fibrotic diseases related to compounds in the network.
Red round: fibrotic diseases related to compounds in the network.
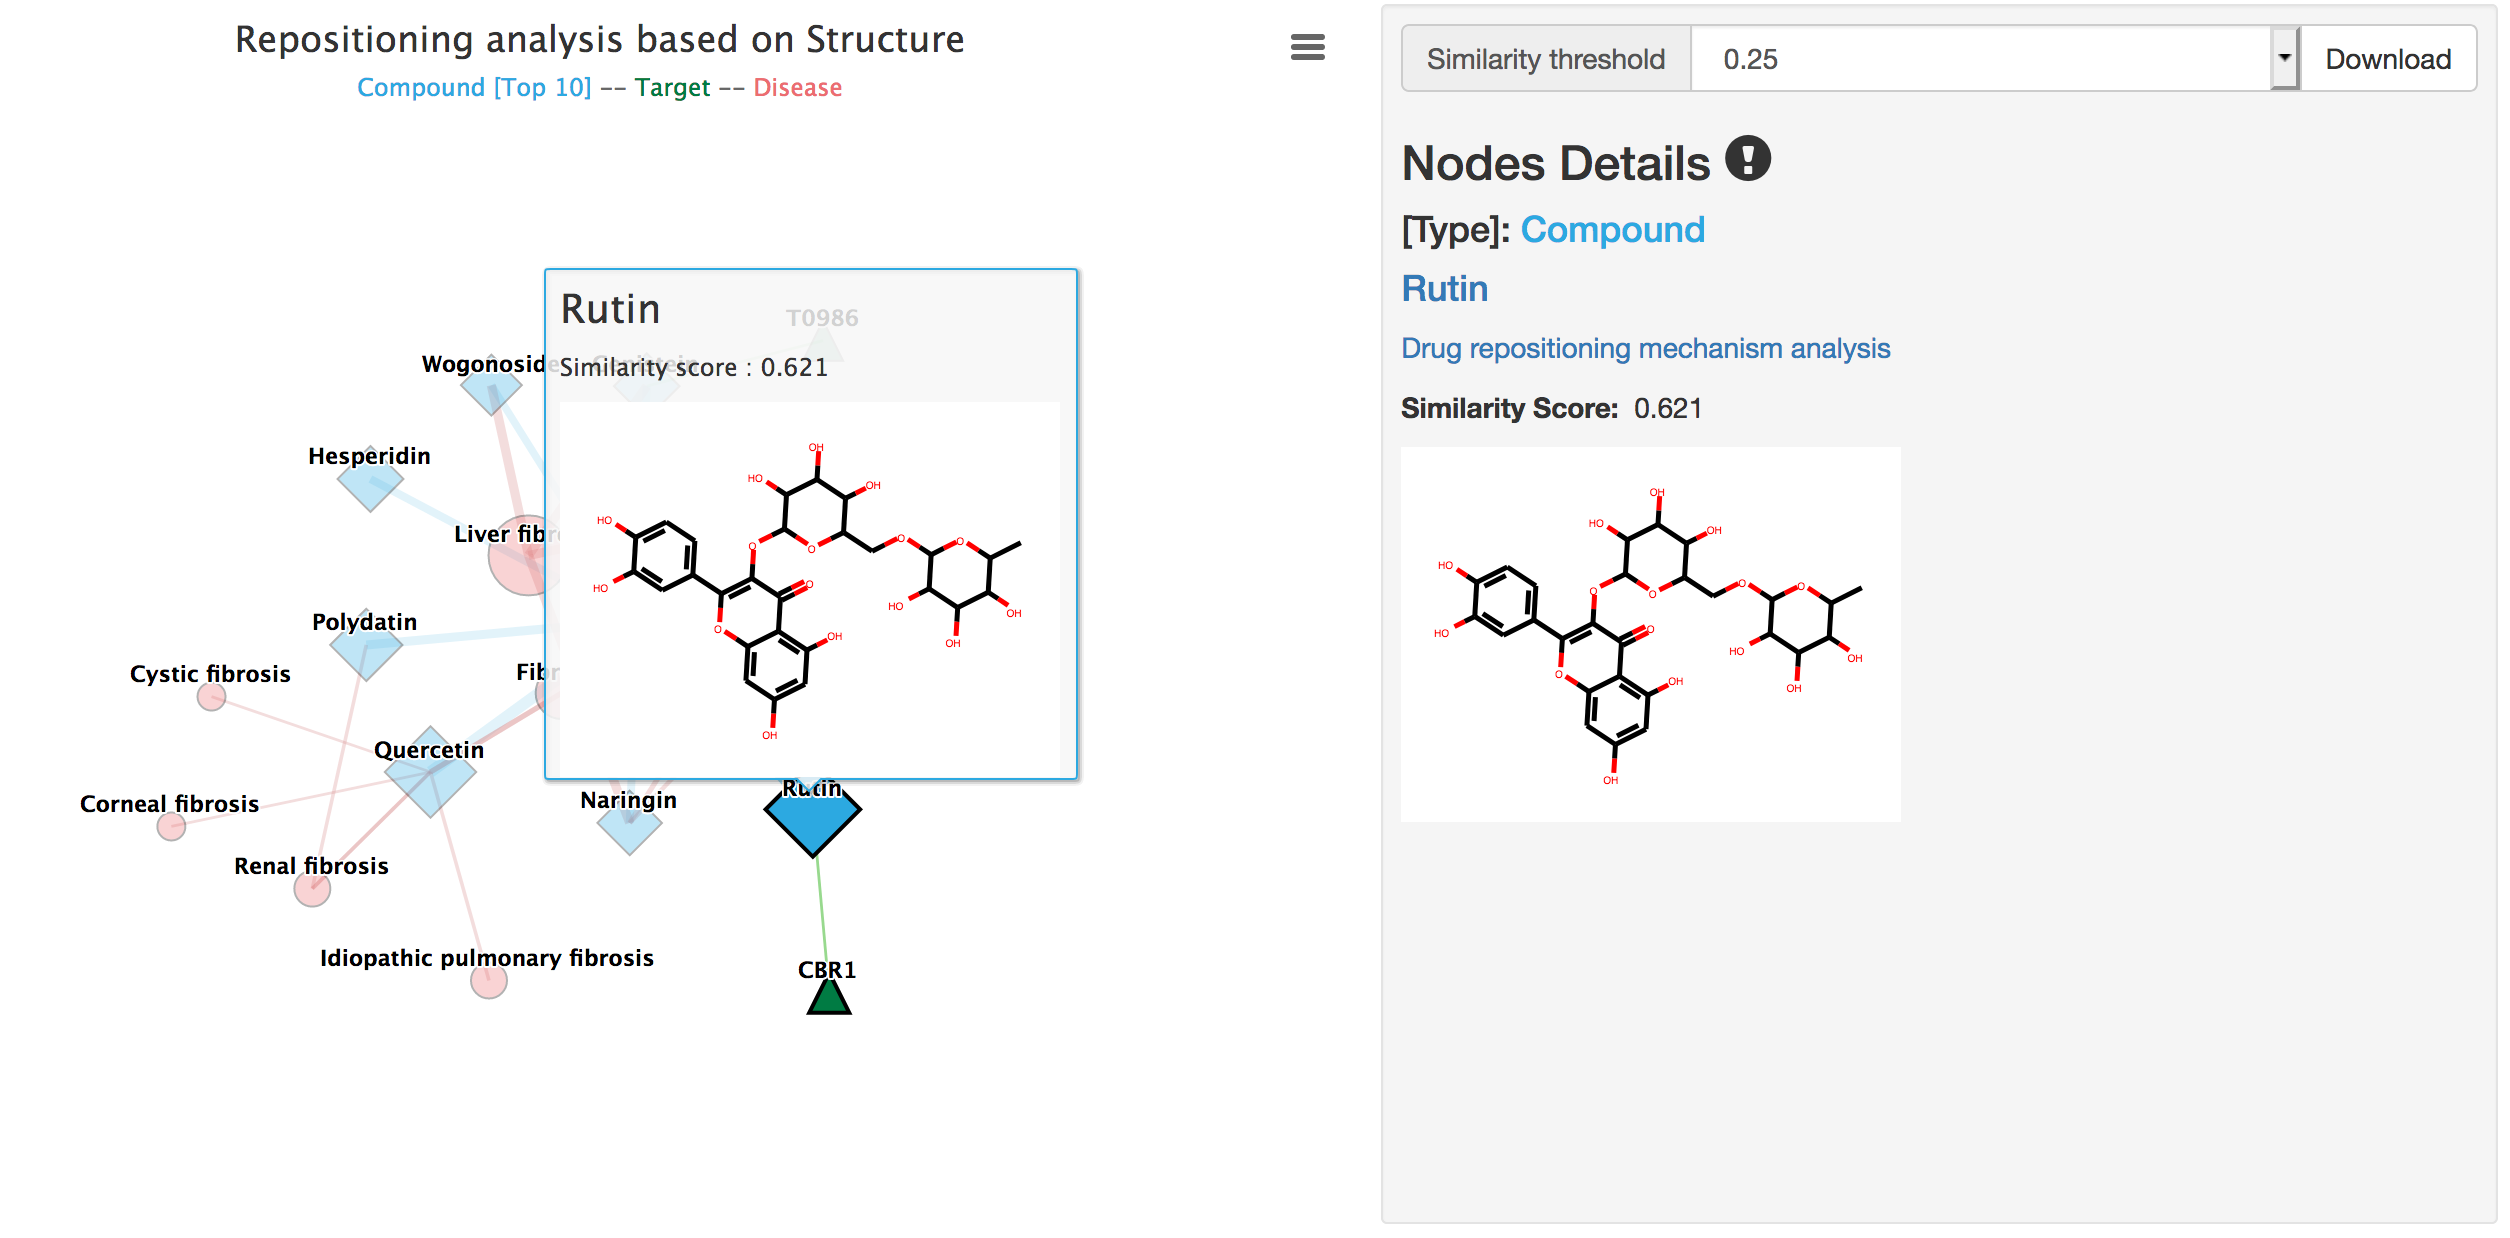
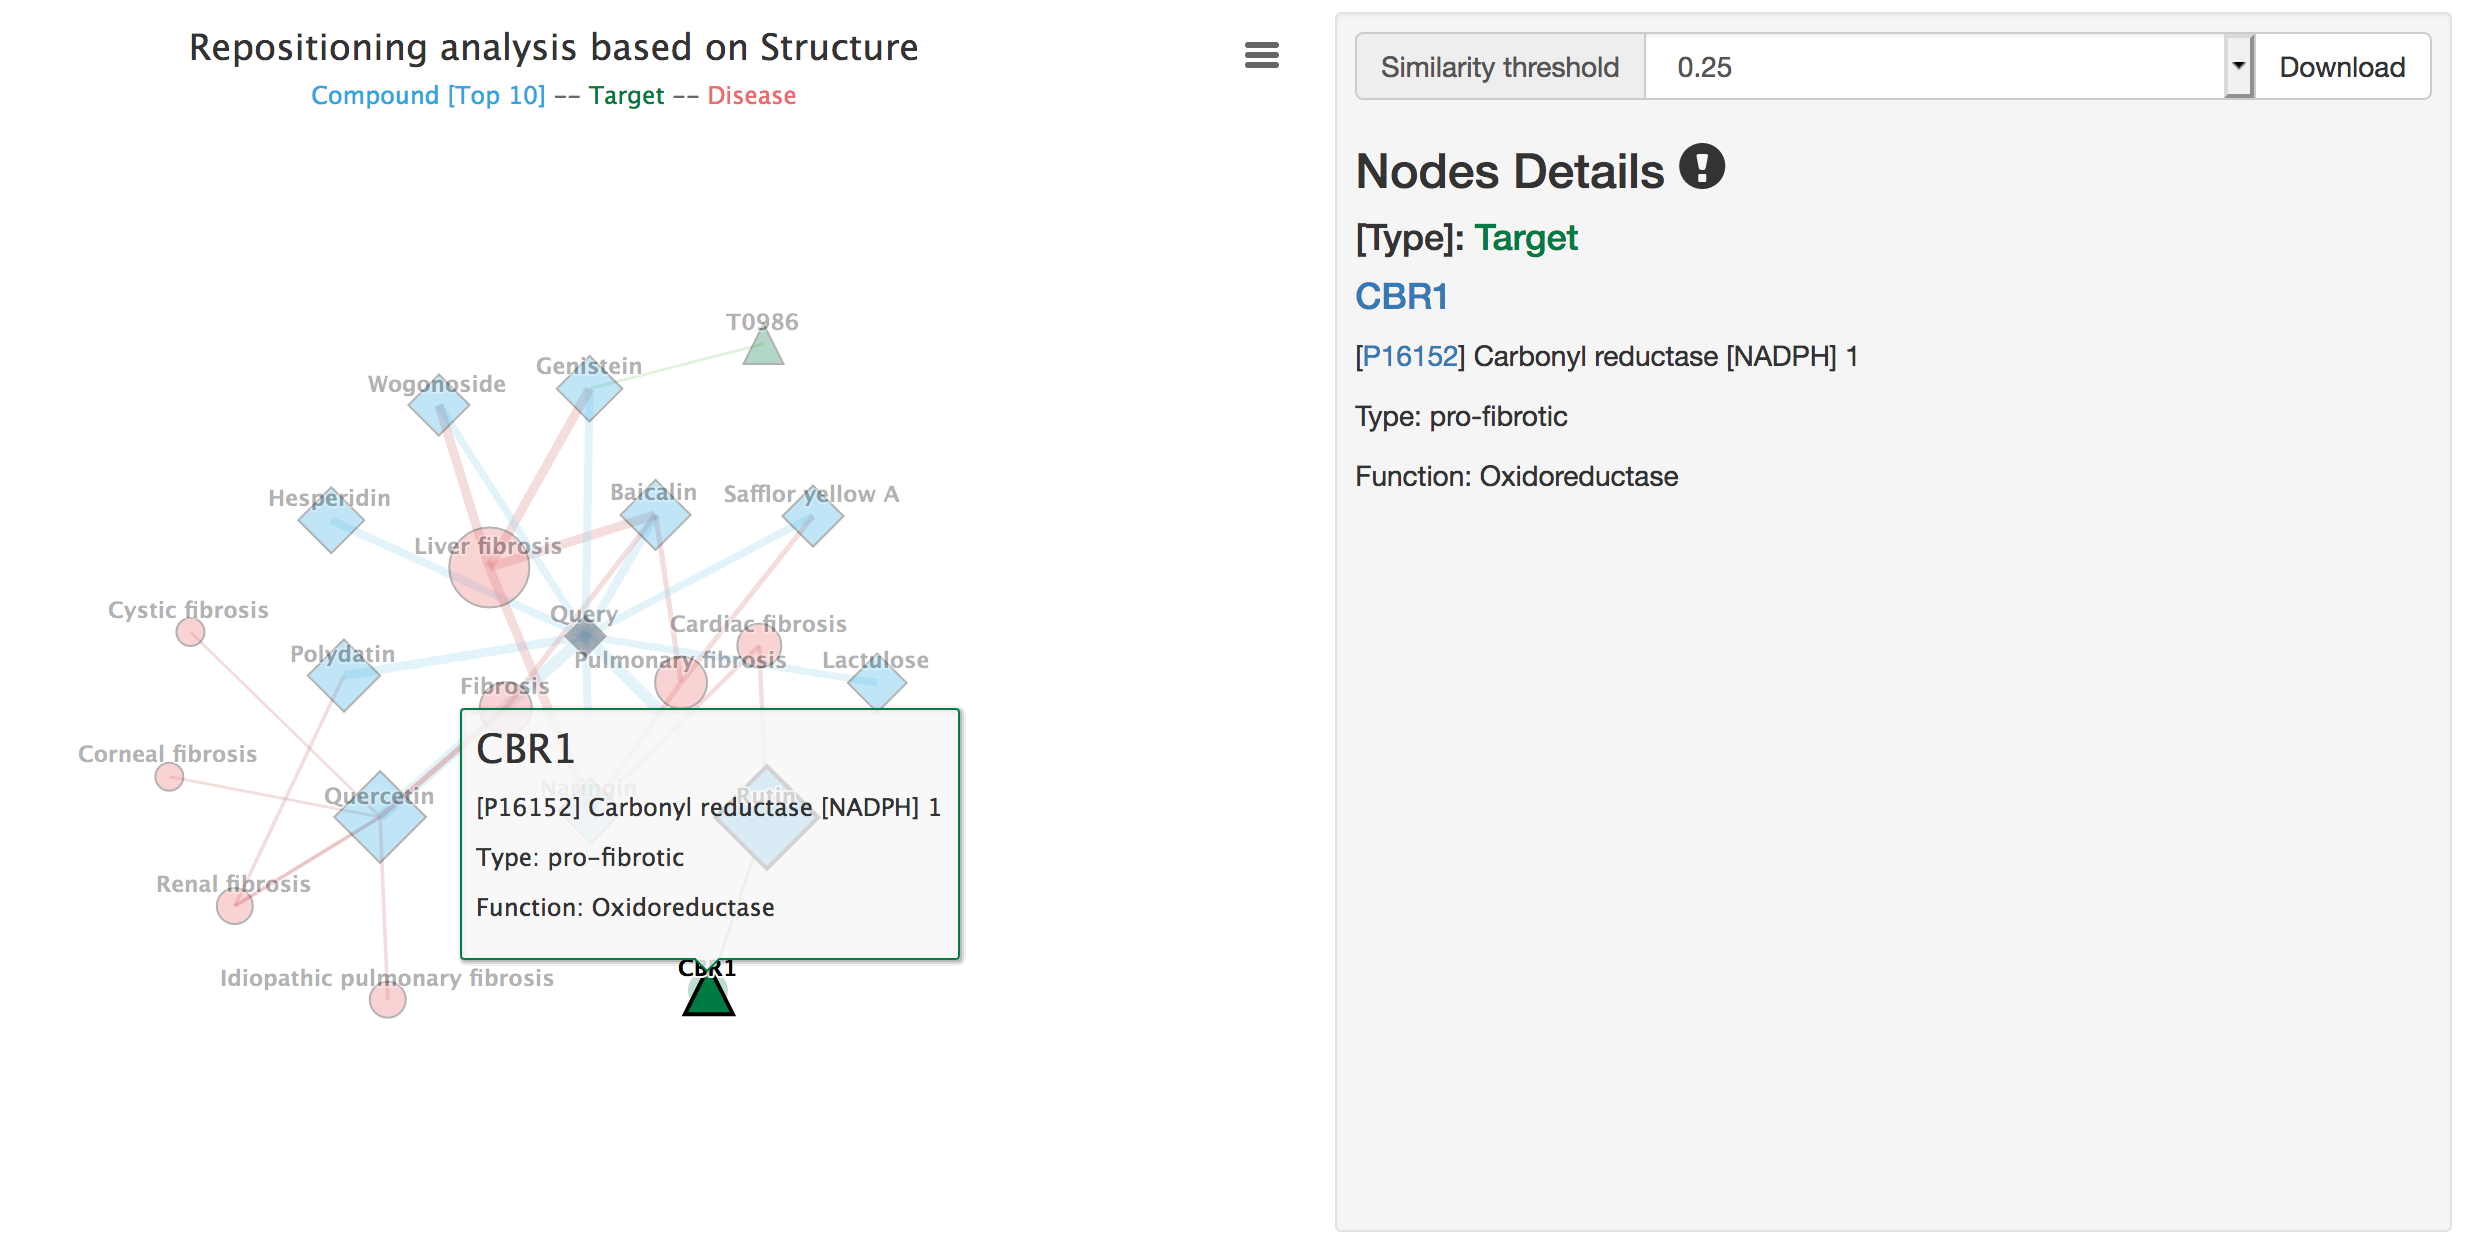
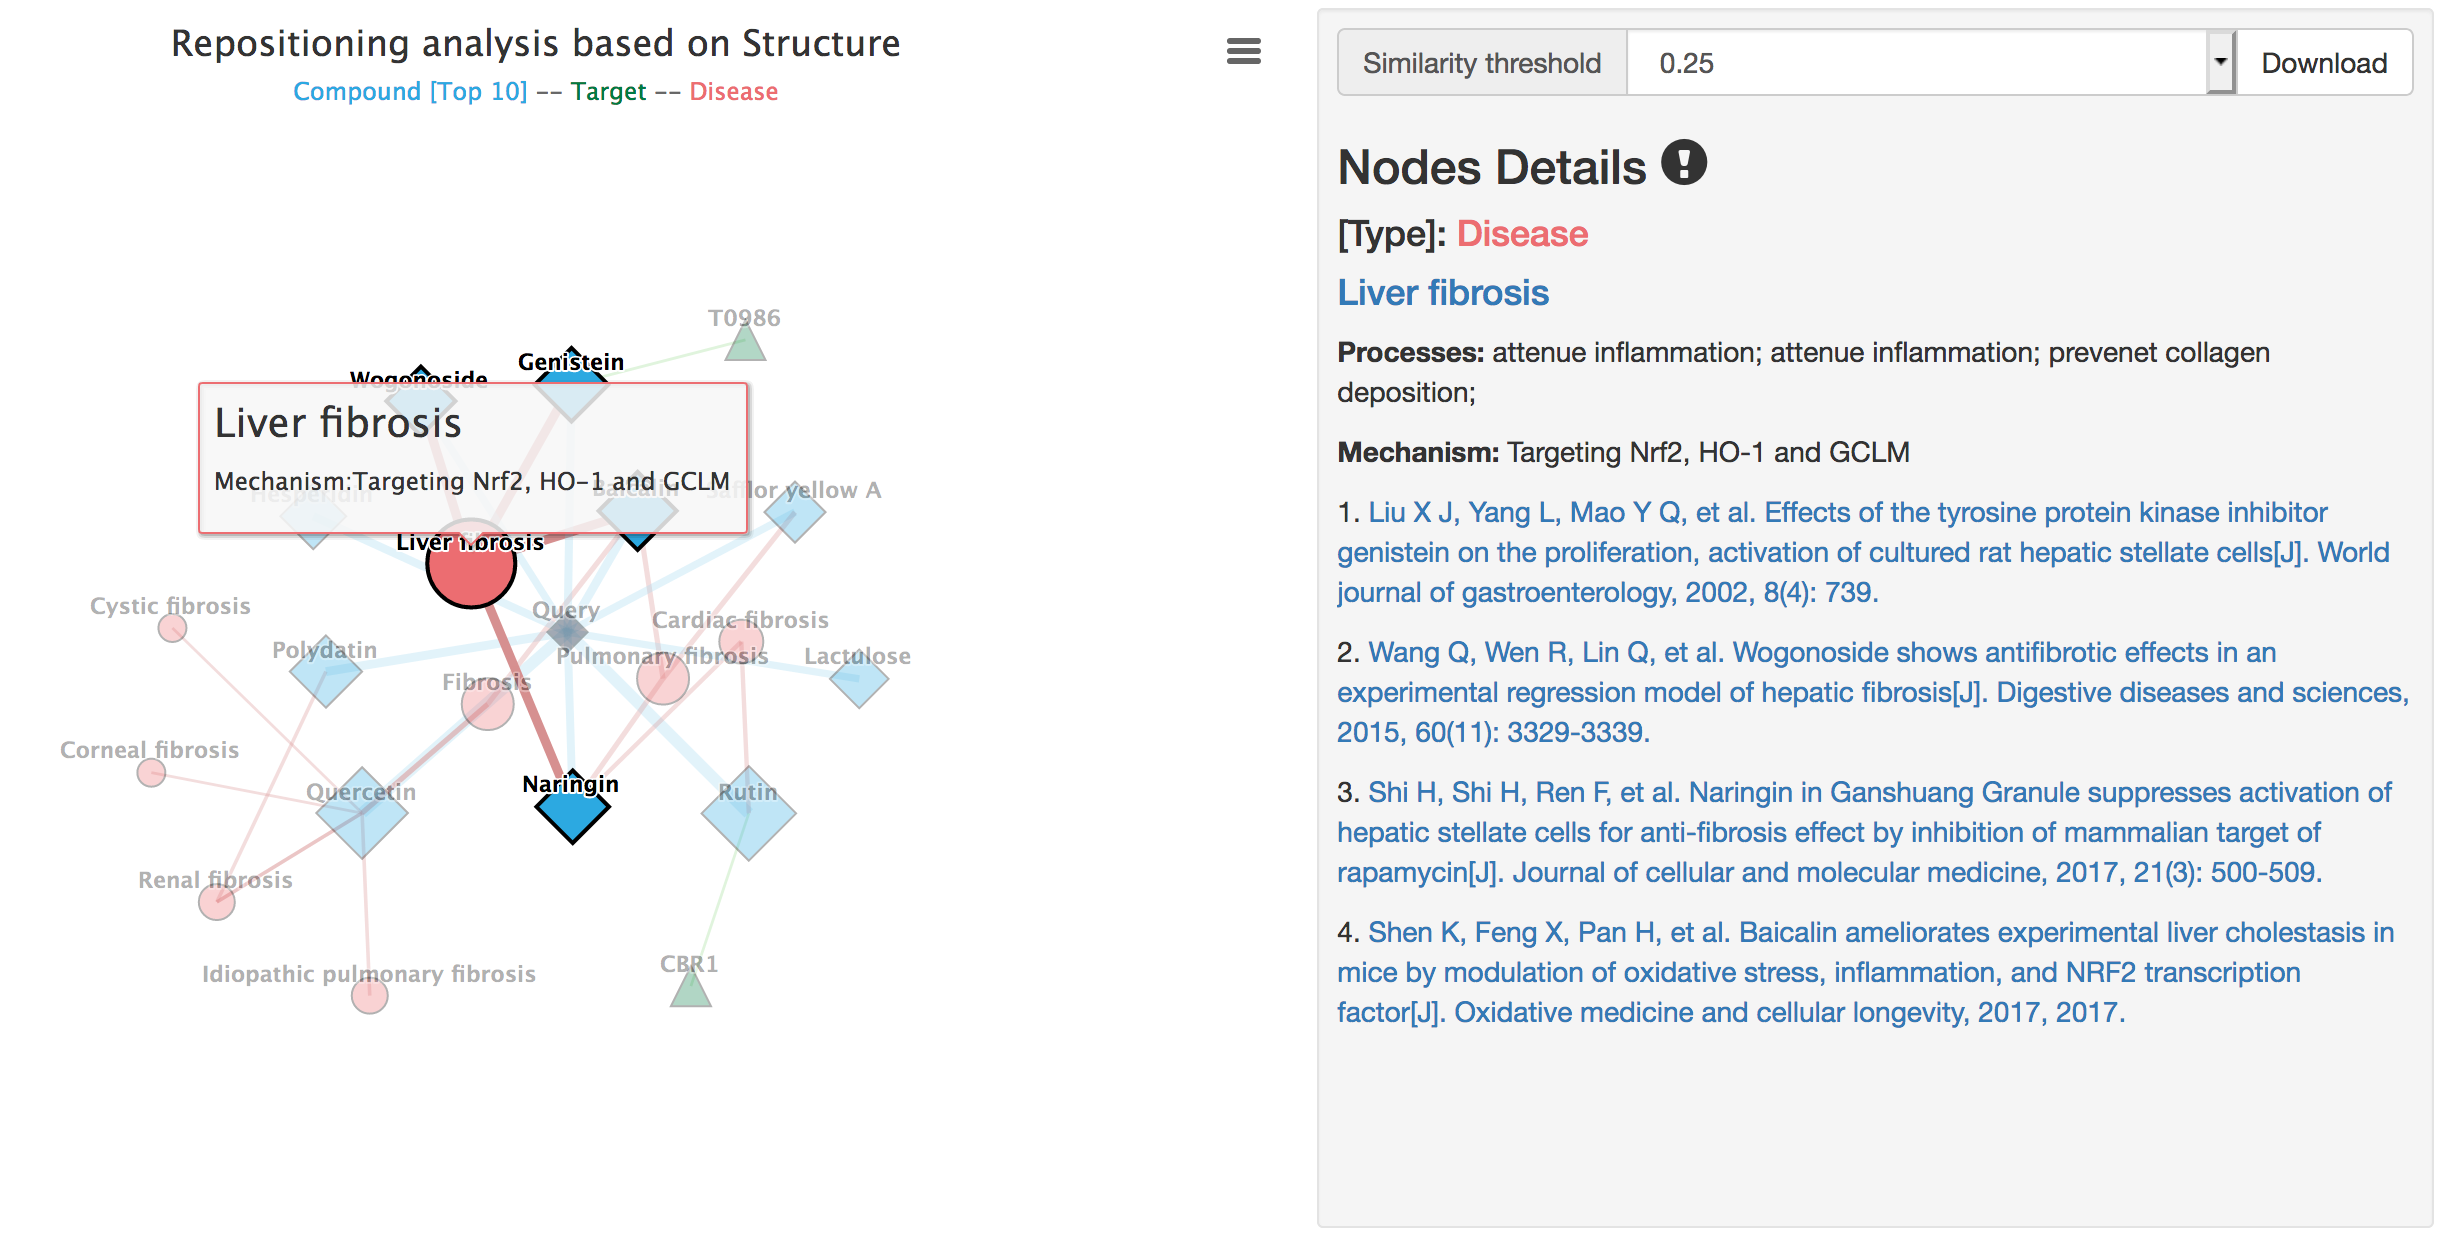
When users click the nodes, the detailed information will be displayed.
Details of compounds include node type, compound name linked to the Compound page, compound similarity score and the 2D chemical structure.
Details of targets include node type, UniProt ID, target name linked to the Target page, target type and target function.
Details of diseases include node type, disease linked to the PubMed MeSH, the anti-fibrosis mechanism and references of associated compounds.
Users can click ![]() thebutton to display the repositioning network in full screen view, to print or download the network. The network chart could be downloaded in .png, .jpeg, .pdf, or .svg format.
thebutton to display the repositioning network in full screen view, to print or download the network. The network chart could be downloaded in .png, .jpeg, .pdf, or .svg format.
3) Network Details and Threshold Setting.
In the Drug Repositioning Mechanism Analysis page, network node details and threshold settings are displayed on the right.
The threshold is the minimum similarity score between the query compound and compounds from the Anti-fibrosis Knowledge Base. The threshold could be set to 0.25, 0.5, 0.75 or 1.
Click the Download button to download all the data of repositioning network.
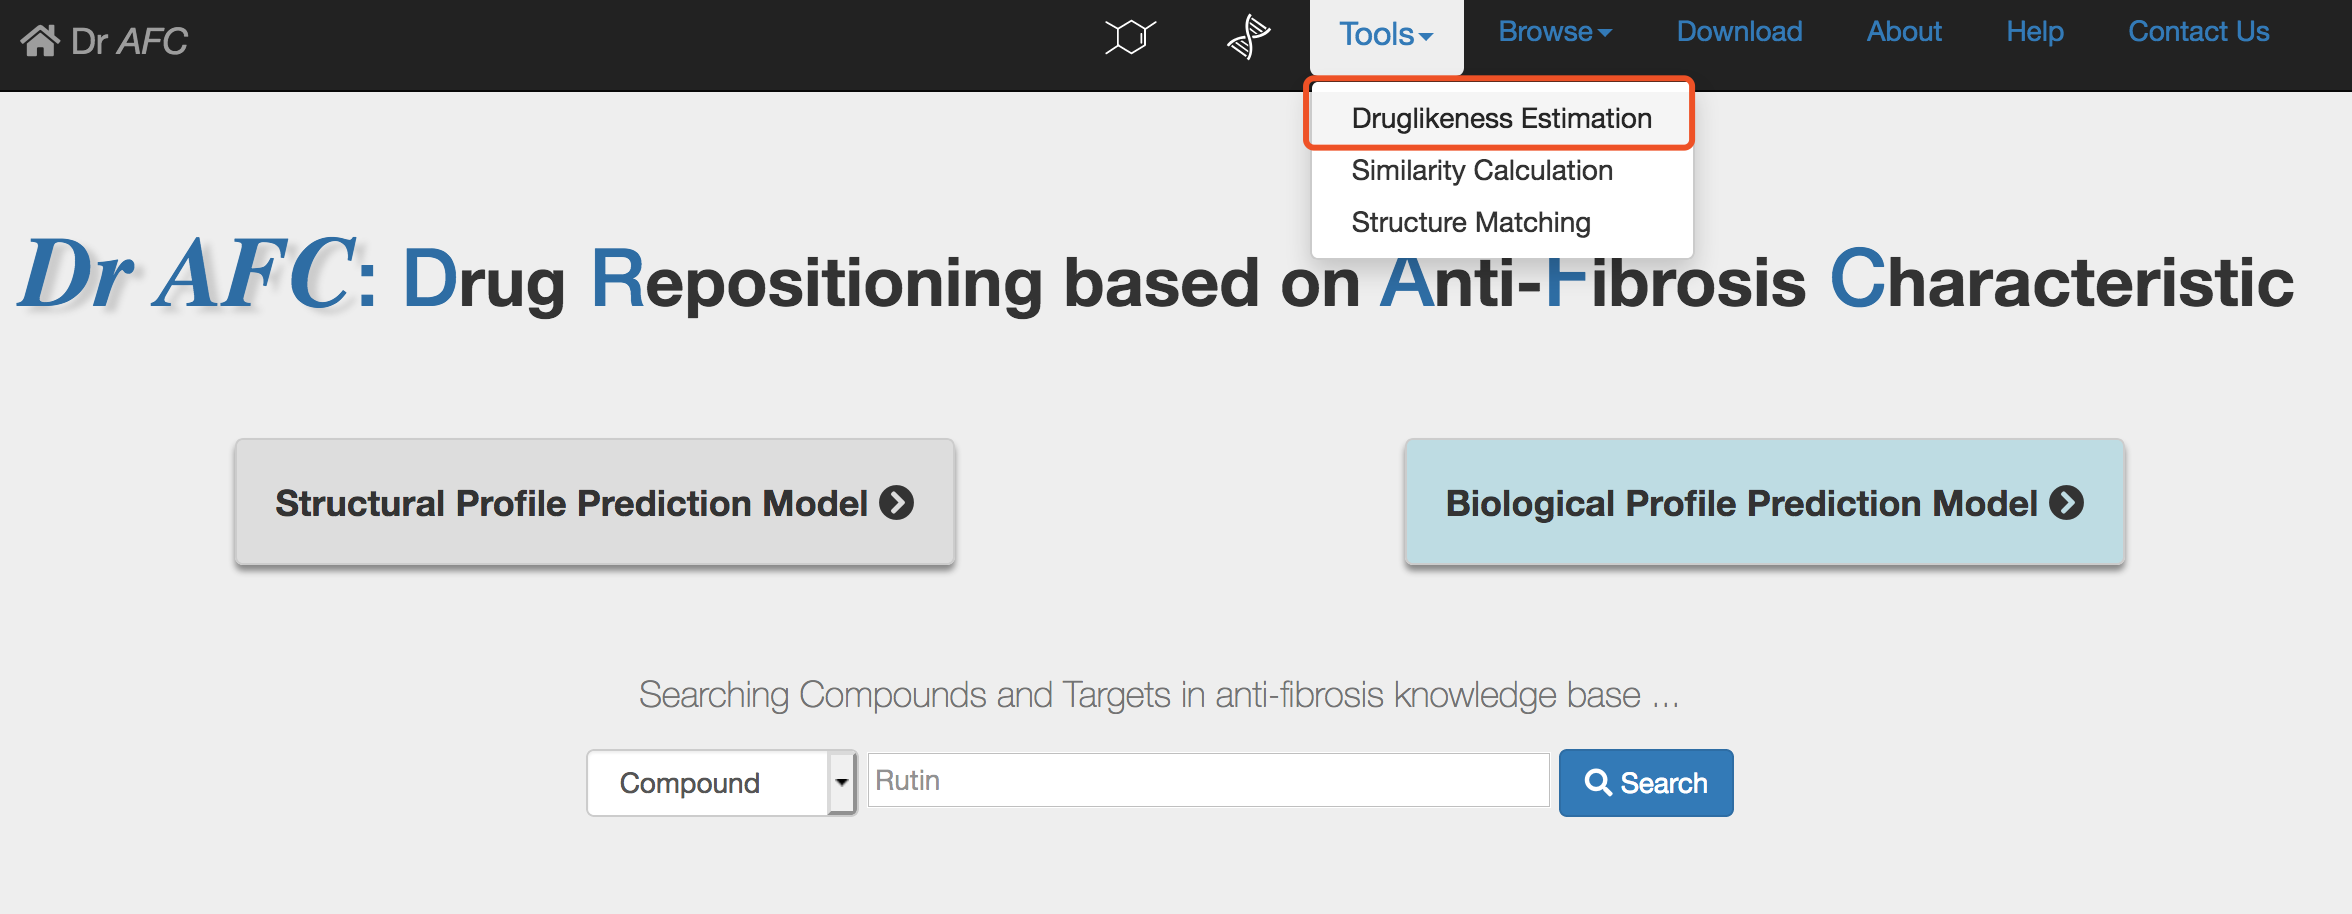
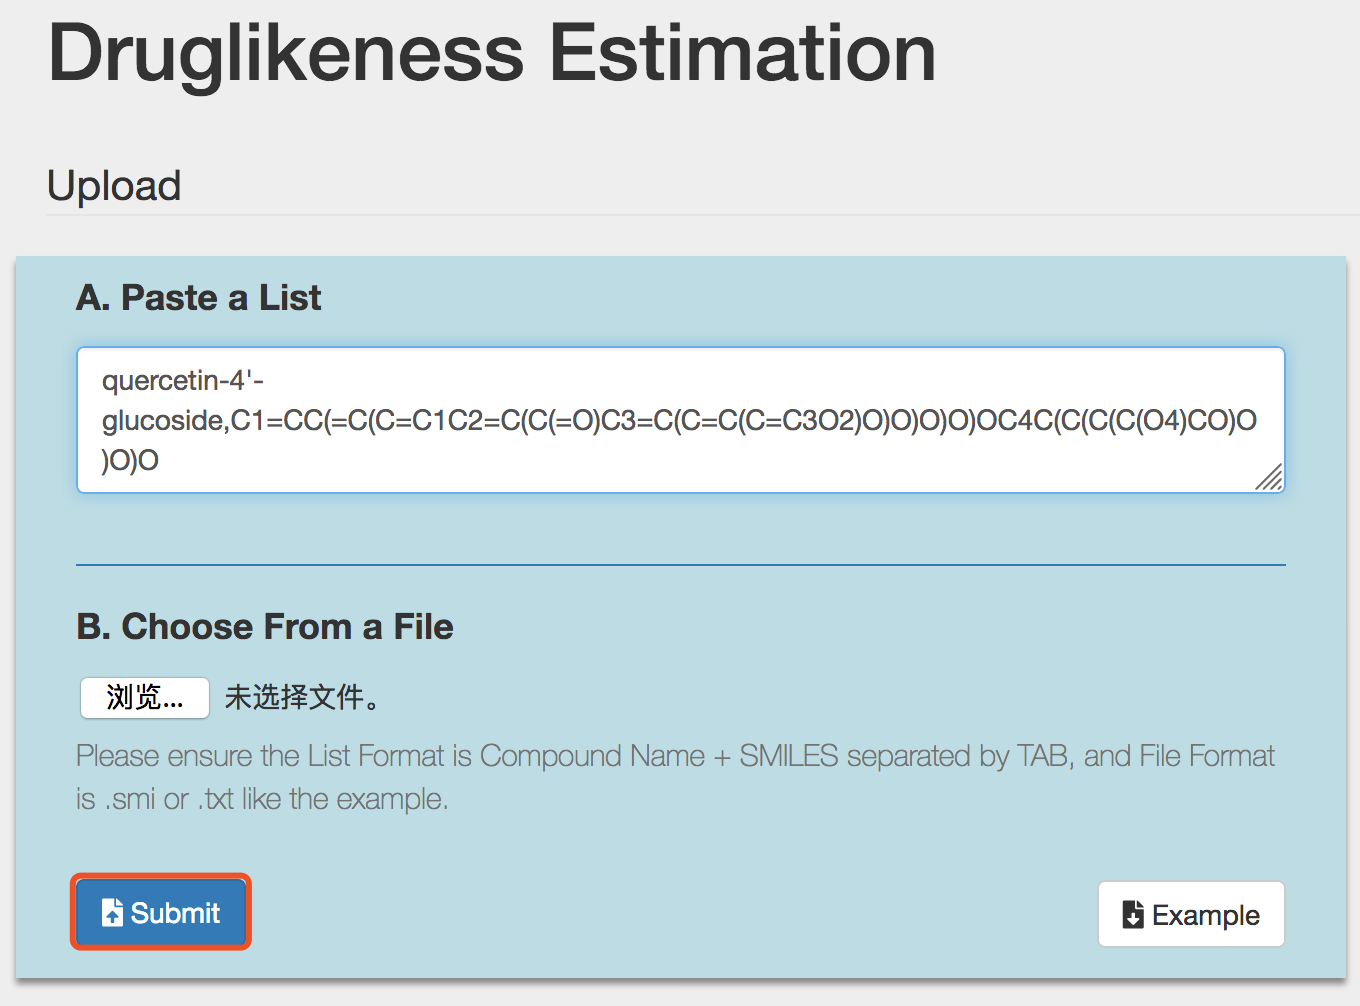
The Druglikeness Estimation of Dr AFC could calculate the quantitative estimation of drug-likeness(QED) for compound, i.e., the druglikeness, based on structural profile[4]. The compound druglikeness reflects the underlying distribution of molecular properties and could serve for the druggability assessment. SMILES strings of compounds could be submitted and the Druglikeness Estimation of Dr AFC will return estimation results.
1) Enter the Druglikeness Estimation page
Click the Tools | Druglikeness Estimation to enter the Druglikeness Estimation submission page.
2) Submit compound structures
Like other functionalities of Dr AFC, Druglikeness Estimation accepts compound structure in two ways, and users can choose either way to submit. The example file of Druglikeness Estimation could also be downloaded by clicking the Example button. Please see section 2 for reference.
Click the Submit button to perform druglikeness estimation.
Tip! Users should use only one way to submit, otherwise Dr AFC will return an error warning.
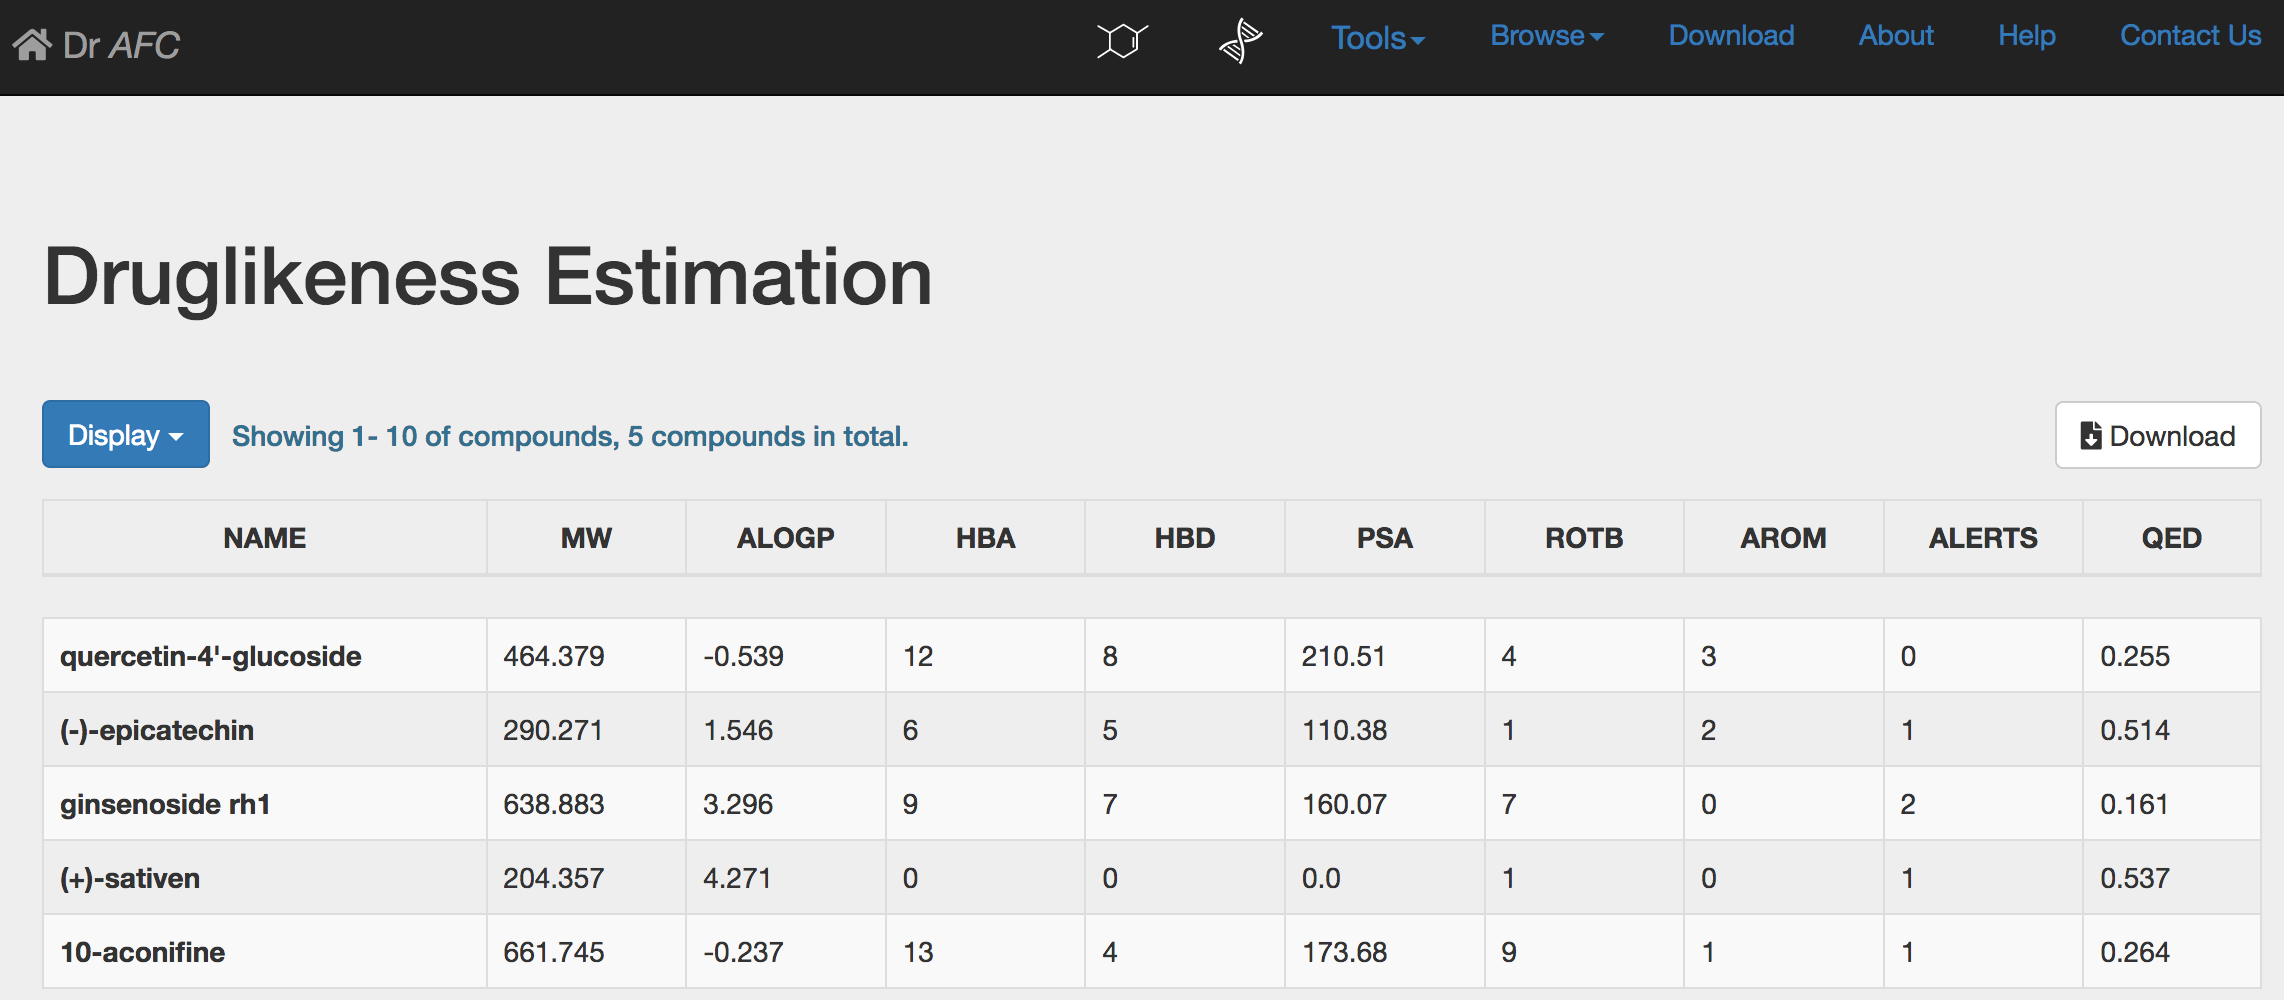
3) Druglikeness Estimation result
Druglikeness Estimation could automatically perform druglikeness estimation and return a result page. The estimation result will be displayed in a ten-column table.
NAME: compound name.
MW: compound molecular weight.
ALOGP: the octanol-water partition coefficient of compound.
HBA: the number of hydrogen bond acceptors of compound.
HBD: the number of hydrogen bond donors of compound.
PSA: the molecular polar surface area of compound.
ROTB: the number of rotatable bonds of compound.
AROM: the number of aromatic rings of compound.
ALERTS: the number of matches for each compound captured.
QED: the druglikeness score, ranging from 0 to 1. Higher score indicates higher druggability.
Same as the SPPM result page, Druglikeness Estimation result table could display first 10, 50 or 100 compounds through setting the Display drop-down list. Users could click the Download button to download the entire prediction result. The downloaded file is a text file separated by Tab. Columns of the downloaded file will be the same as the displayed table. Please see section 2.
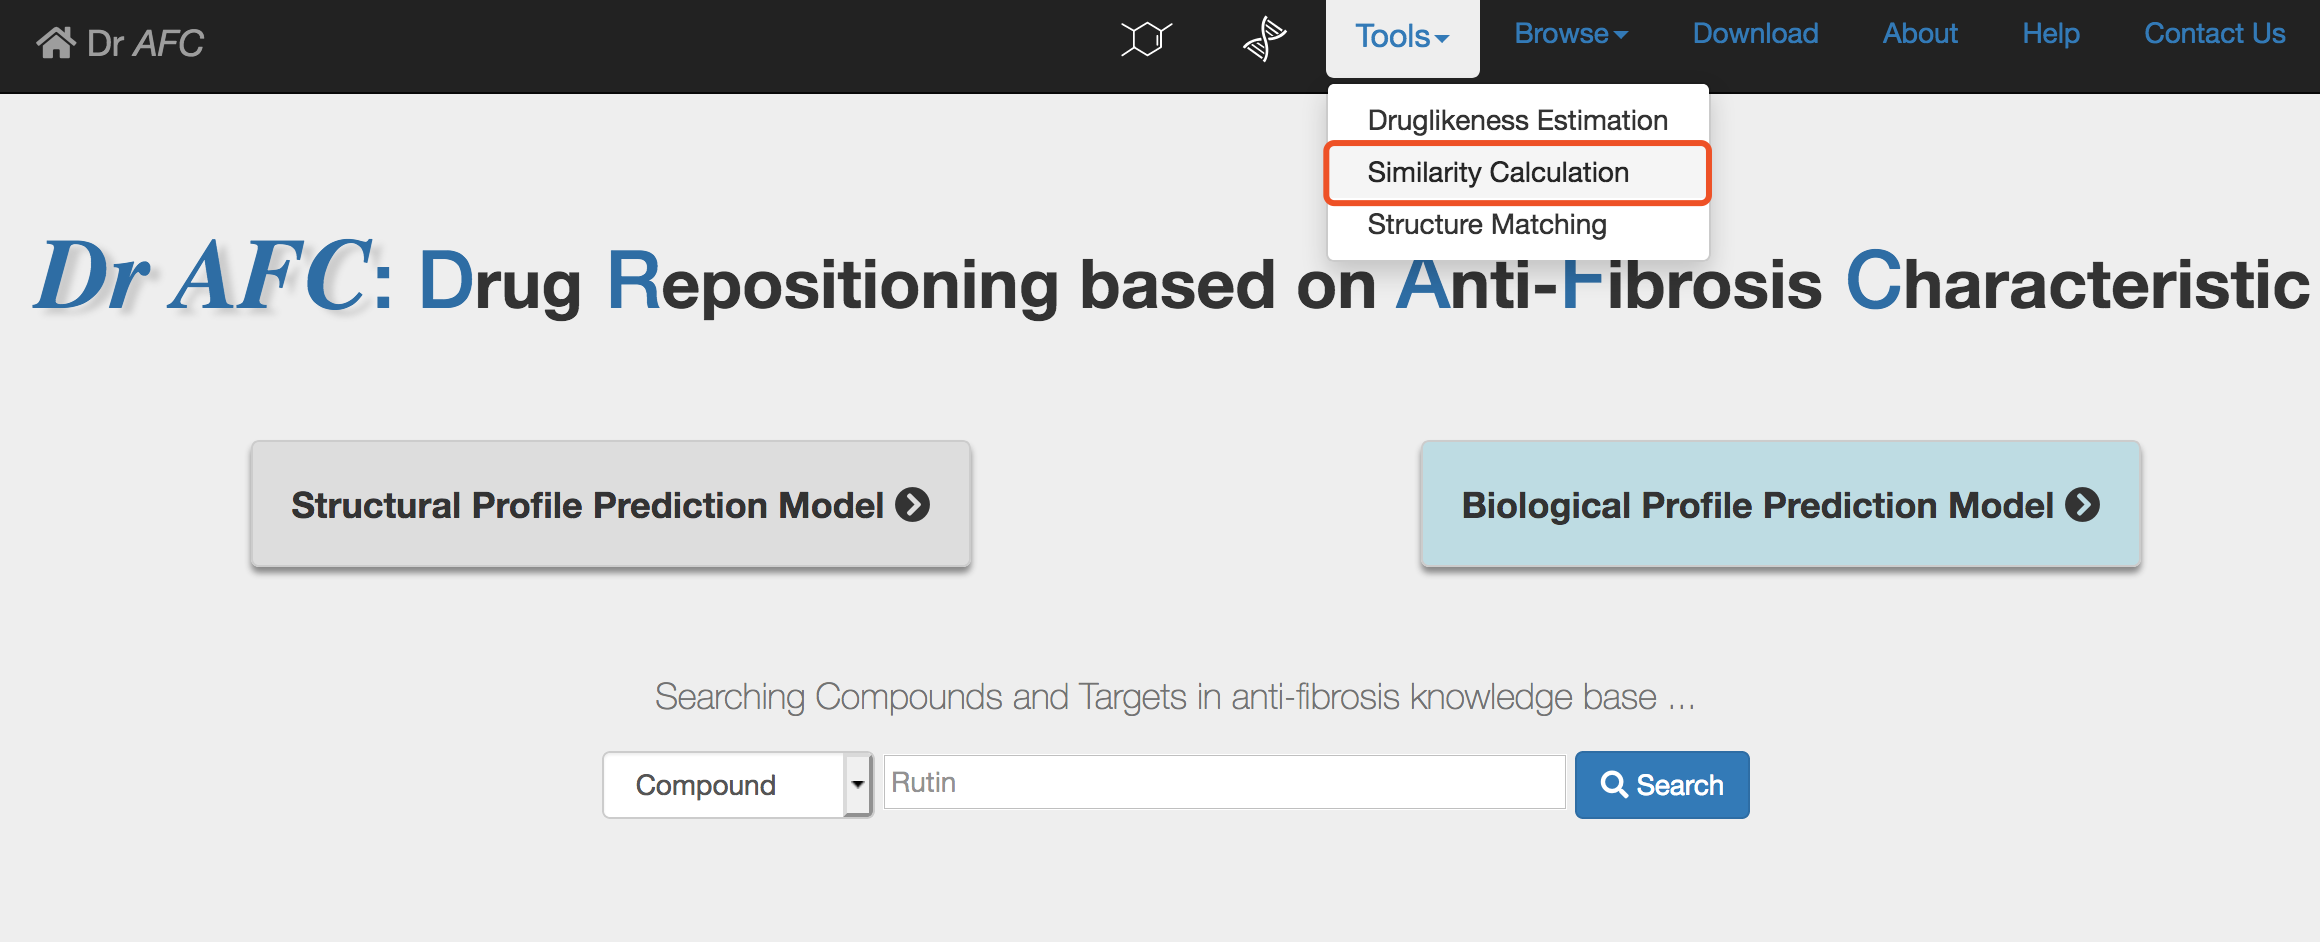
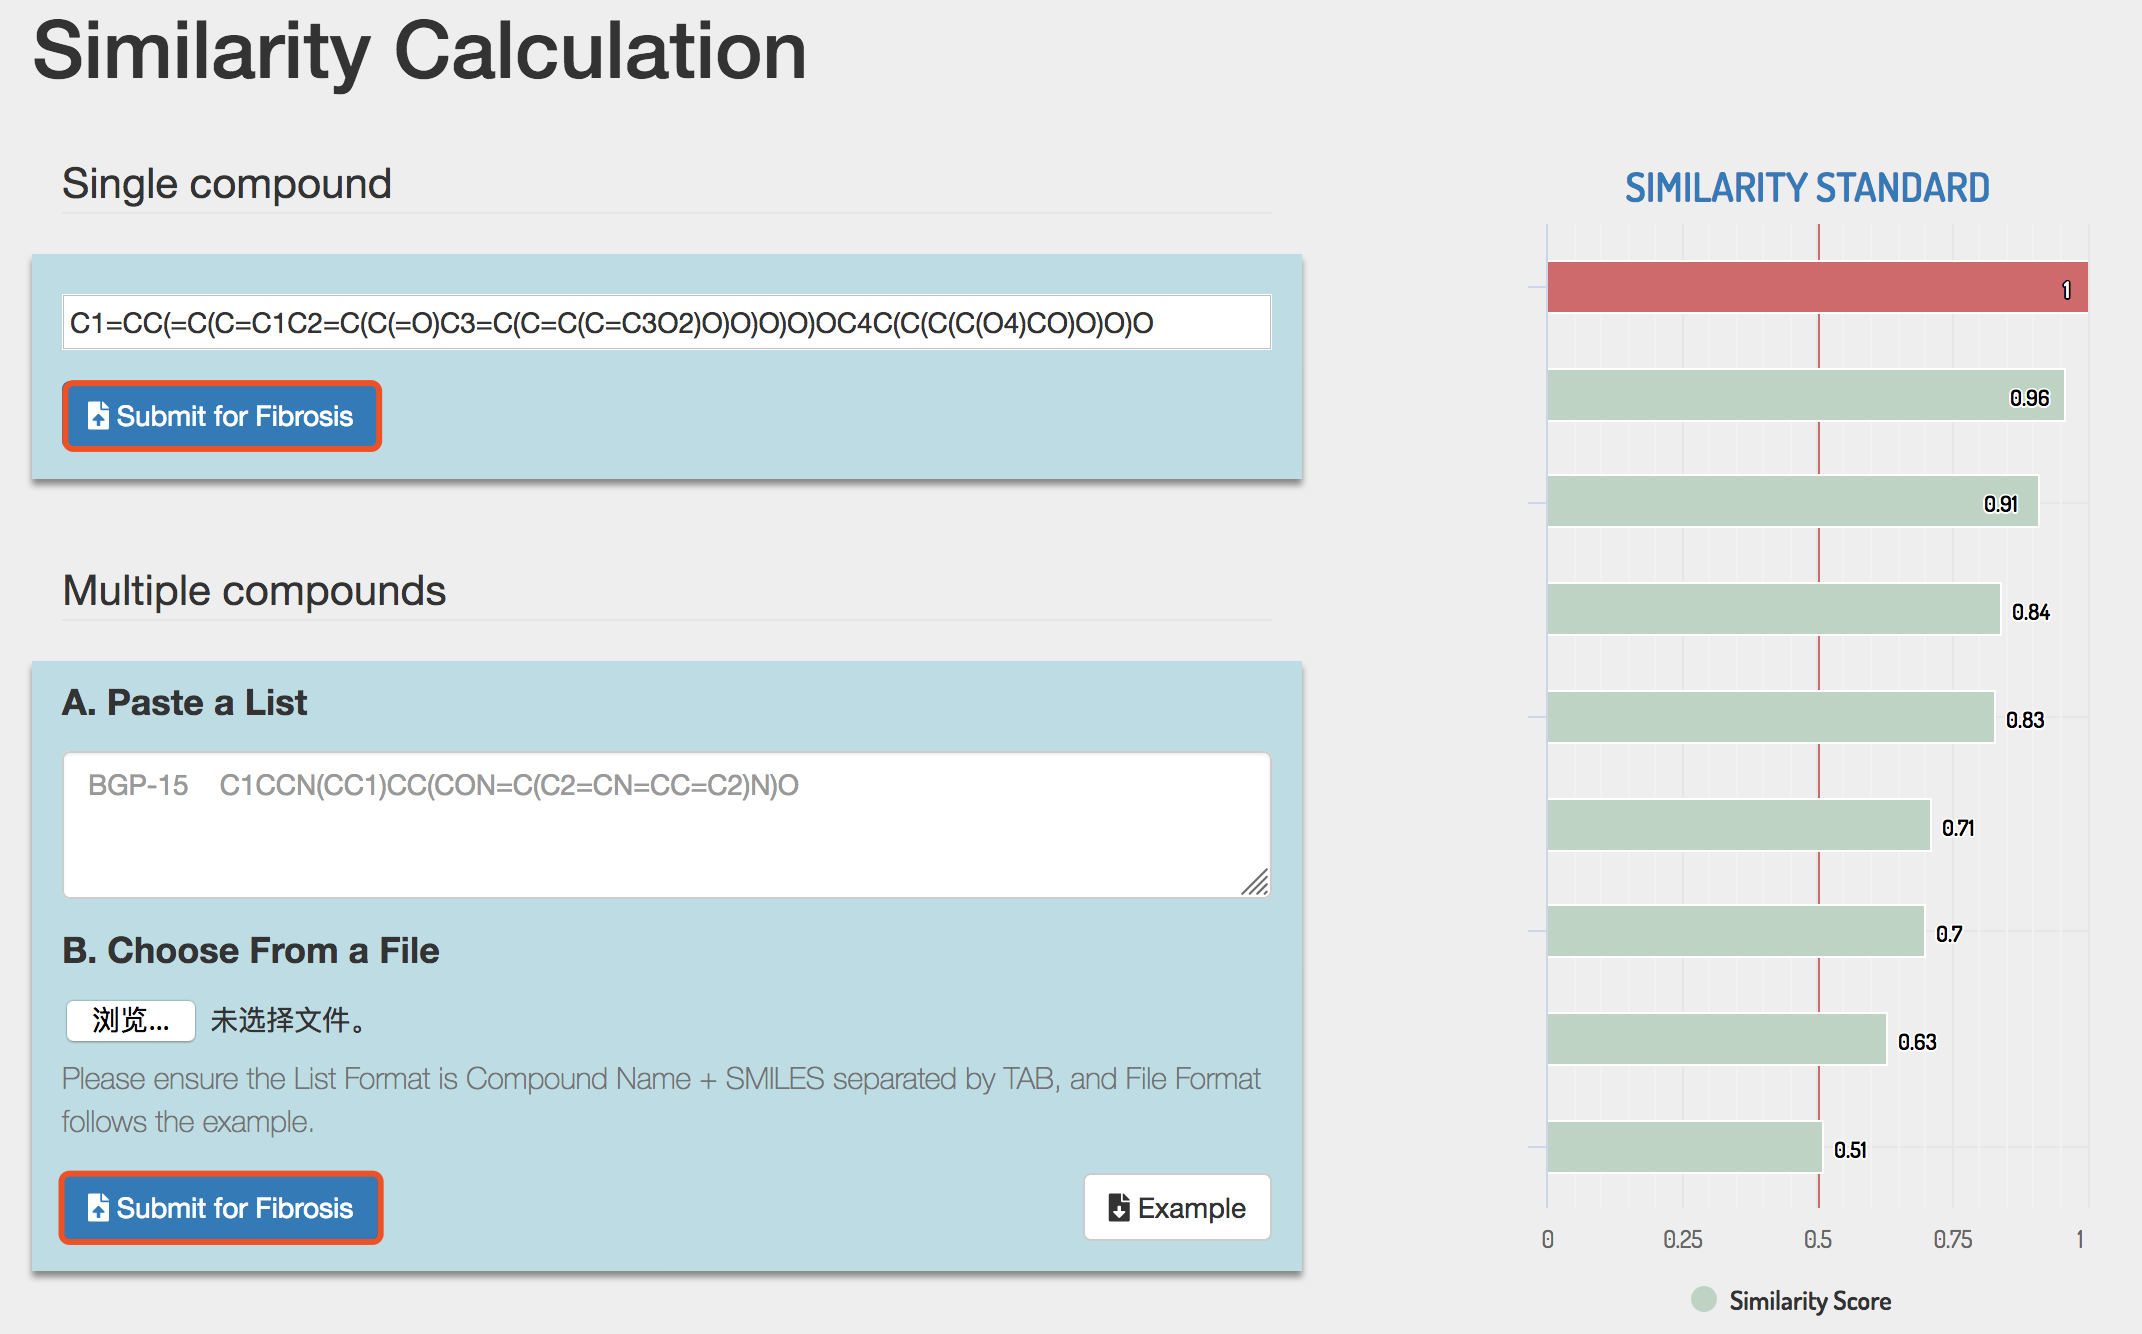
The Similarity Calculation of Dr AFC could calculate the Tanimoto similarity between submitted compounds and anti-fibrosis compounds in Anti-fibrosis Knowledge Base. The molecular similarity is calculated through R-based package in RDkit[5]. SMILES strings of compounds could be uploaded and the Similarity Calculation of Dr AFC will return calculation results.
1) Enter the Similarity Calculation page
Click the Tools | Similarity Calculation to enter the Similarity Calculation submission page.
2) Submit compound structures
Similarity Calculation accepts both single compound and multiple compounds and return different result pages.
In single compound submission, enter or paste the SMILES string of compound and click the Submit button to perform similarity calculation.
e.g. C1=CC(=C(C=C1C2=C(C(=O)C3=C(C=C(C=C3O2)O)O)O)O)OC4C(C(C(C(O4)CO)O)O)O
In multiple compounds submission, Similarity Calculation accepts compound structures in two ways, and users can choose either way to submit. The example file of Similarity Calculation could also be downloaded by clicking the Example button. Please see section 2.
Click the Submit button to perform similarity calculation.
Tip! Users should use only one way to submit, otherwise Dr AFC will return an error warning.
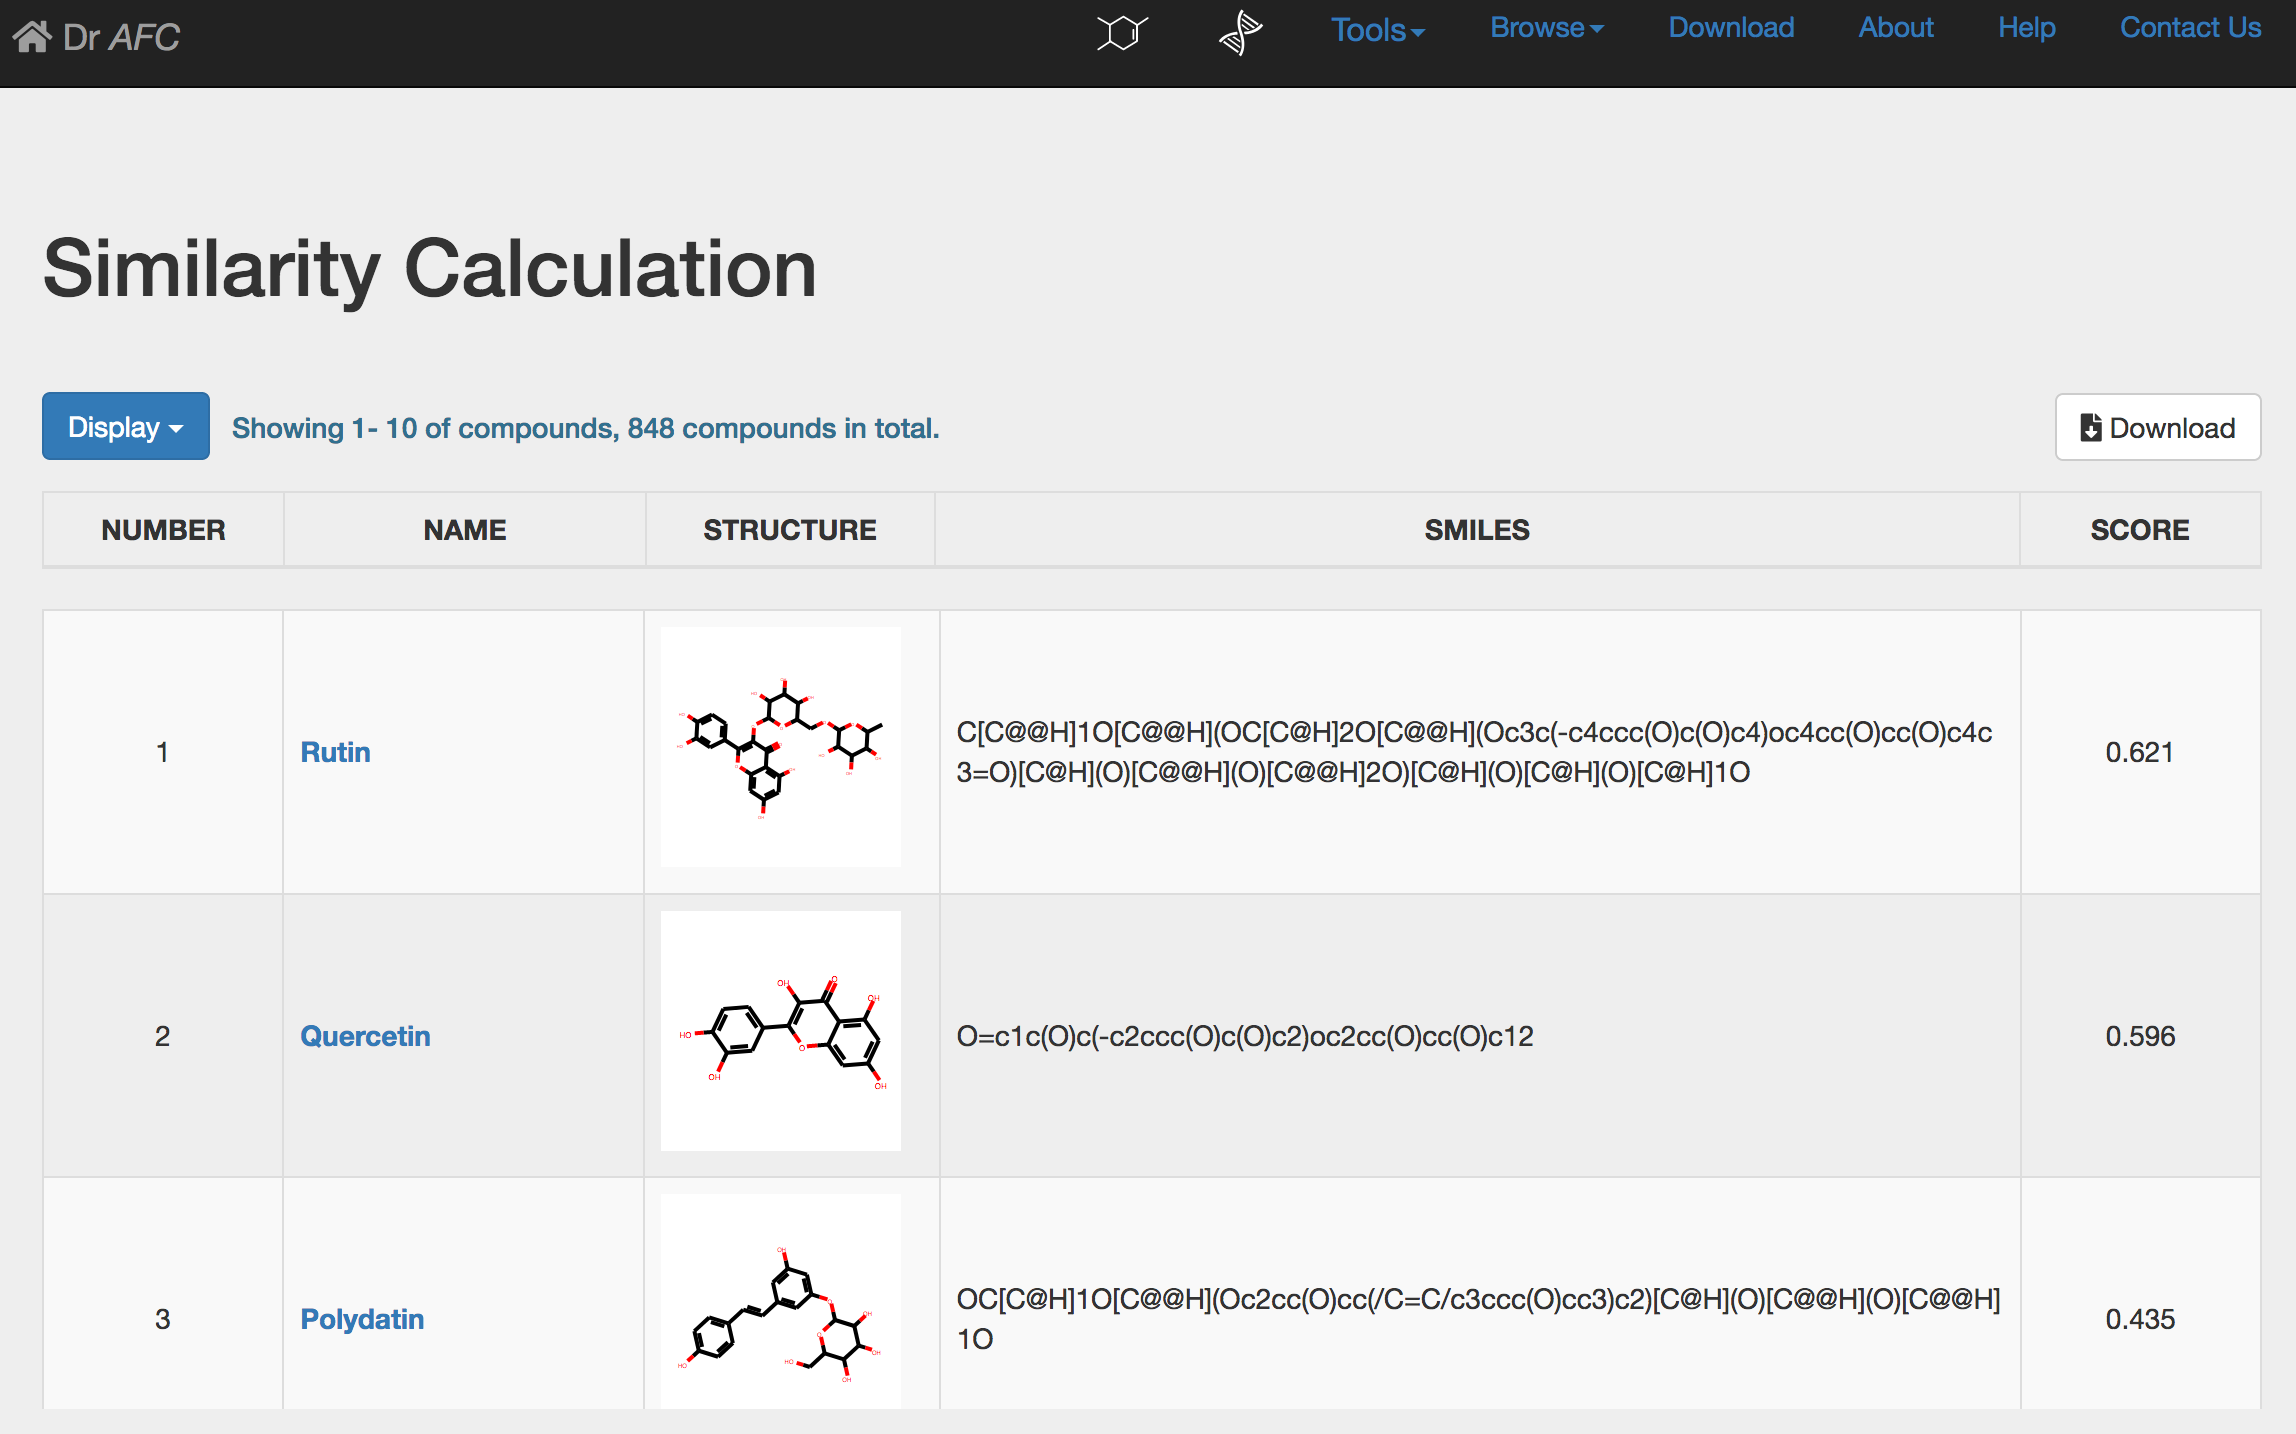
3) Similarity Calculation result
If single compound is submitted, Similarity Calculation could automatically perform similarity calculation and return a result page. The calculation result will be displayed in a five-column table.
NUMBER: compound order ranked by similarity score.
NAME: retrieved compound name from the Anti-fibrosis Knowledge Base.
STRUCTURE: the 2D chemical structure generated by SMILES string. Users could click the picture to zoom in the chemical structure in a new page.
SMILES: the SMILES string of compound.
SCORE: calculated Tanimoto similarity score, ranging from 0 to 1. Higher score indicates higher similarity.
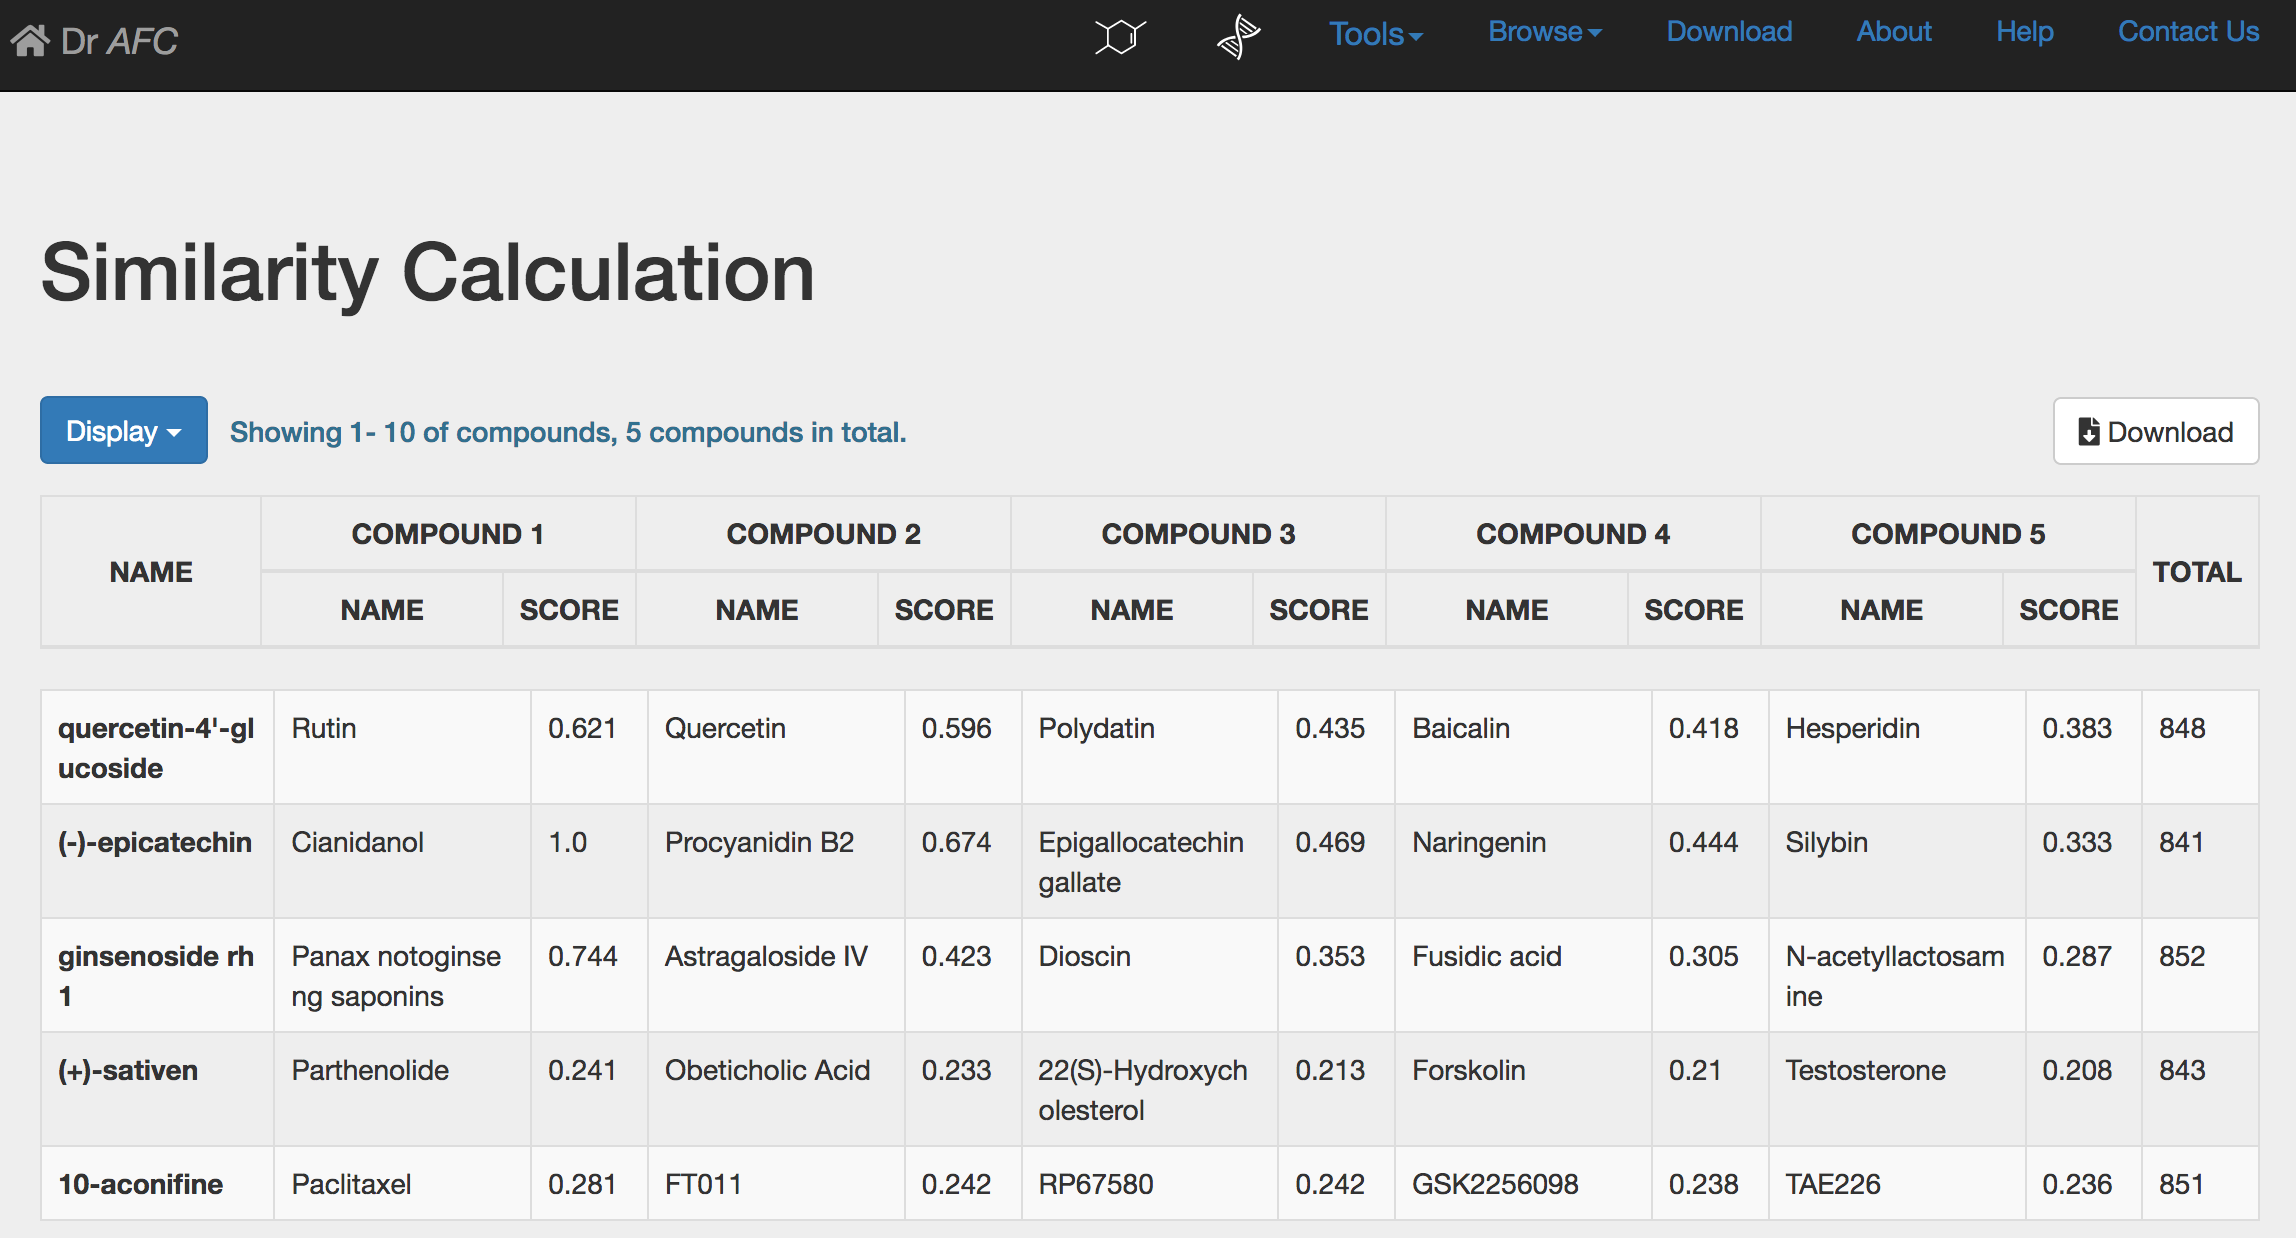
If multiple compounds are submitted, Similarity Calculation would return a different result page. The calculation result will be displayed in a twelve-column table.
NAME: compound name.
COMPOUND 1(NAME): the first compound name ranked by similarity score in the Anti-fibrosis Knowledge Base.
COMPOUND 1(SCORE): the similarity score of top ranked compound.
(Like COMPOUND 1, COMOUND 2-5 refer to the subsequent compounds and their scores)
TOTAL: the total number of retrieved compounds from the Anti-fibrosis Knowledge Base.
As before, two different Similarity Calculation result tables could display first 10, 50 or 100 compounds through setting the Display drop-down list. Users could click the Download button to download the entire calculation result. The downloaded file is a text file separated by Tab. The file columns are the same as the displayed table. Please see section 2.
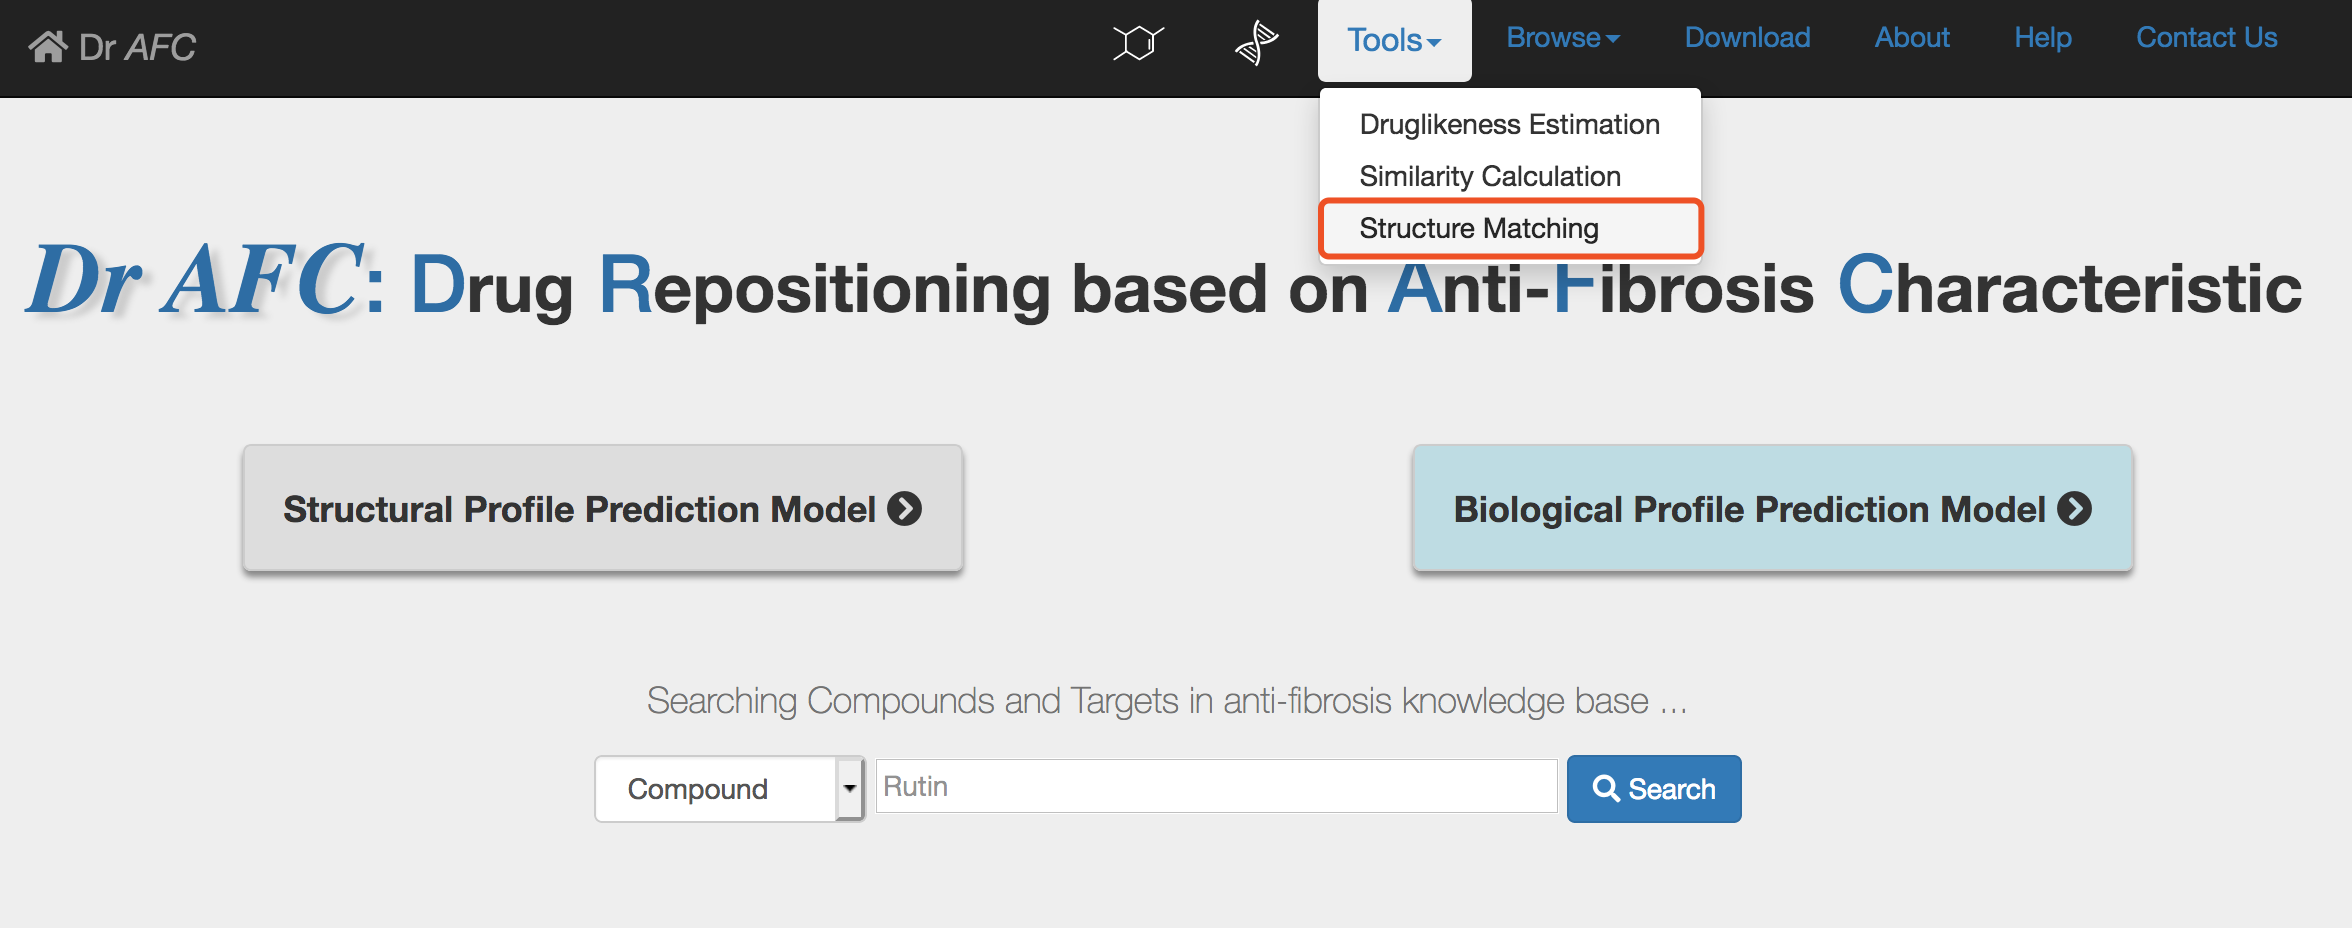
The Structure Matching of Dr AFC could look for compound from Anti-fibrosis Knowledge Base that match exactly the query compound, or match the query compound with its substructure. The matching is performed based on RDkit[5]. SMILES strings of compounds could be uploaded and the Structure Matching of Dr AFC will return matching results.
1) Enter the Structure Matching page
Click the Tools | Structure Matching to enter the Structure Matching submission page.
2) Submit compound structures
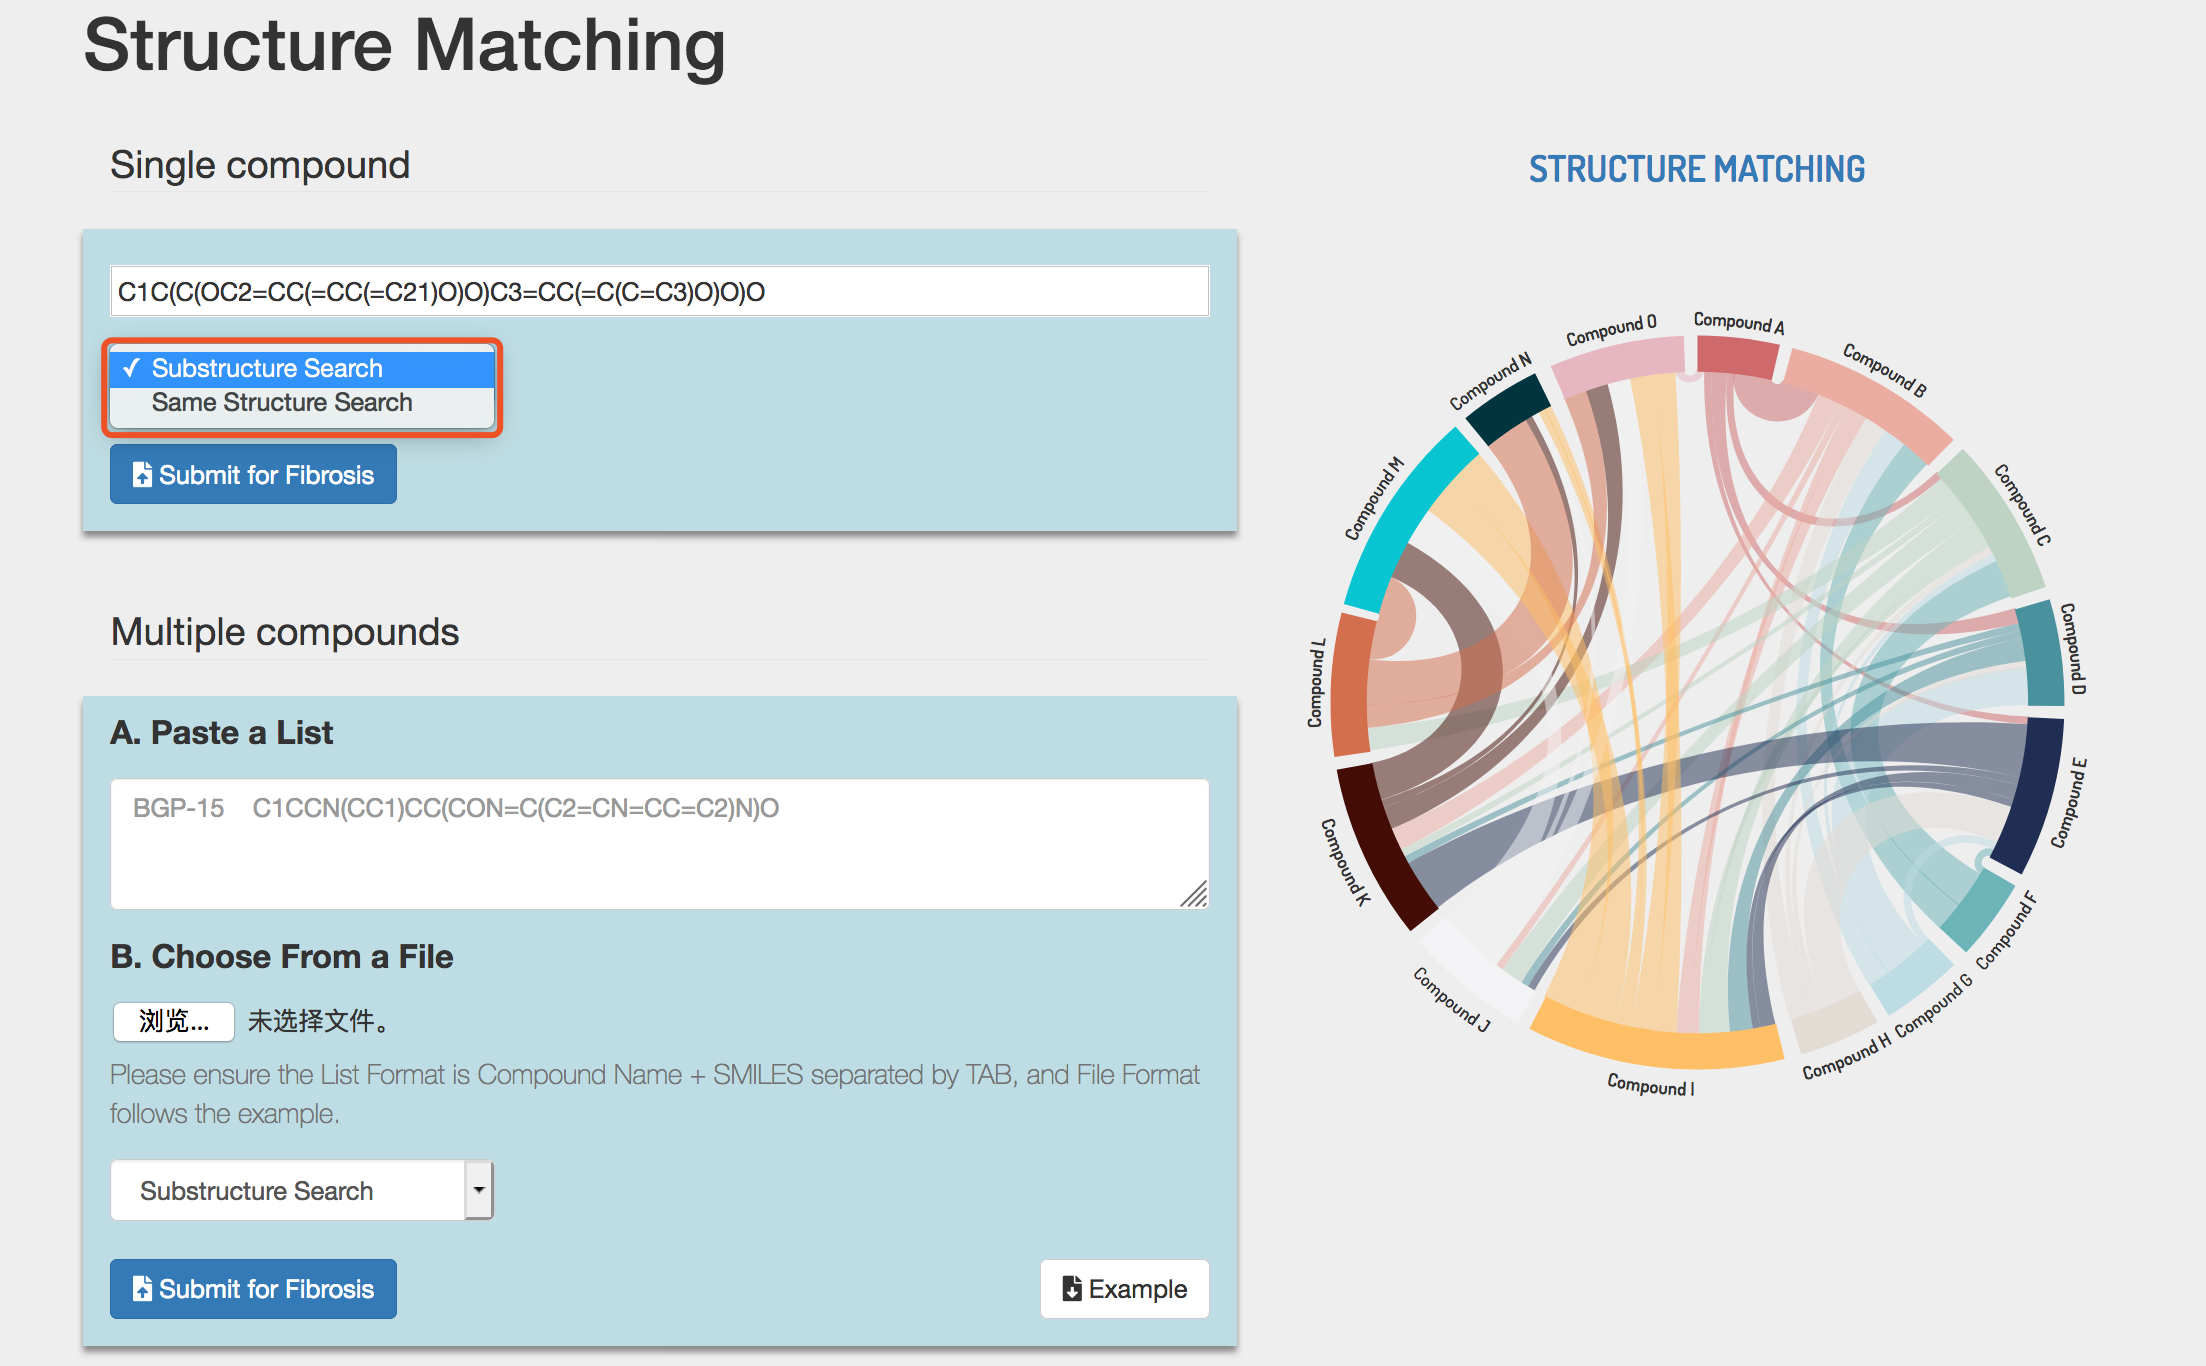
Structure Matching accepts both single compound and multiple compounds. Furthermore, Structure Matching could perform exact structure matching and substructure matching.
In single compound submission, enter or paste the SMILES string of compound and click the Submit button to perform similarity calculation.
e.g. C1C(C(OC2=CC(=CC(=C21)O)O)C3=CC(=C(C=C3)O)O)O
In multiple compounds submission, Structure Matching accepts compound structures in two ways, and users can choose either way to submit. The example file of Structure Matching could also be downloaded by clicking the Example button. Please see section 2.
Select Substructure Search or Same Structure Search. Click the Submit button to perform structure matching.
Tip! Users should use only one way to submit, otherwise Dr AFC will return an error warning.
3) Structure Matching result
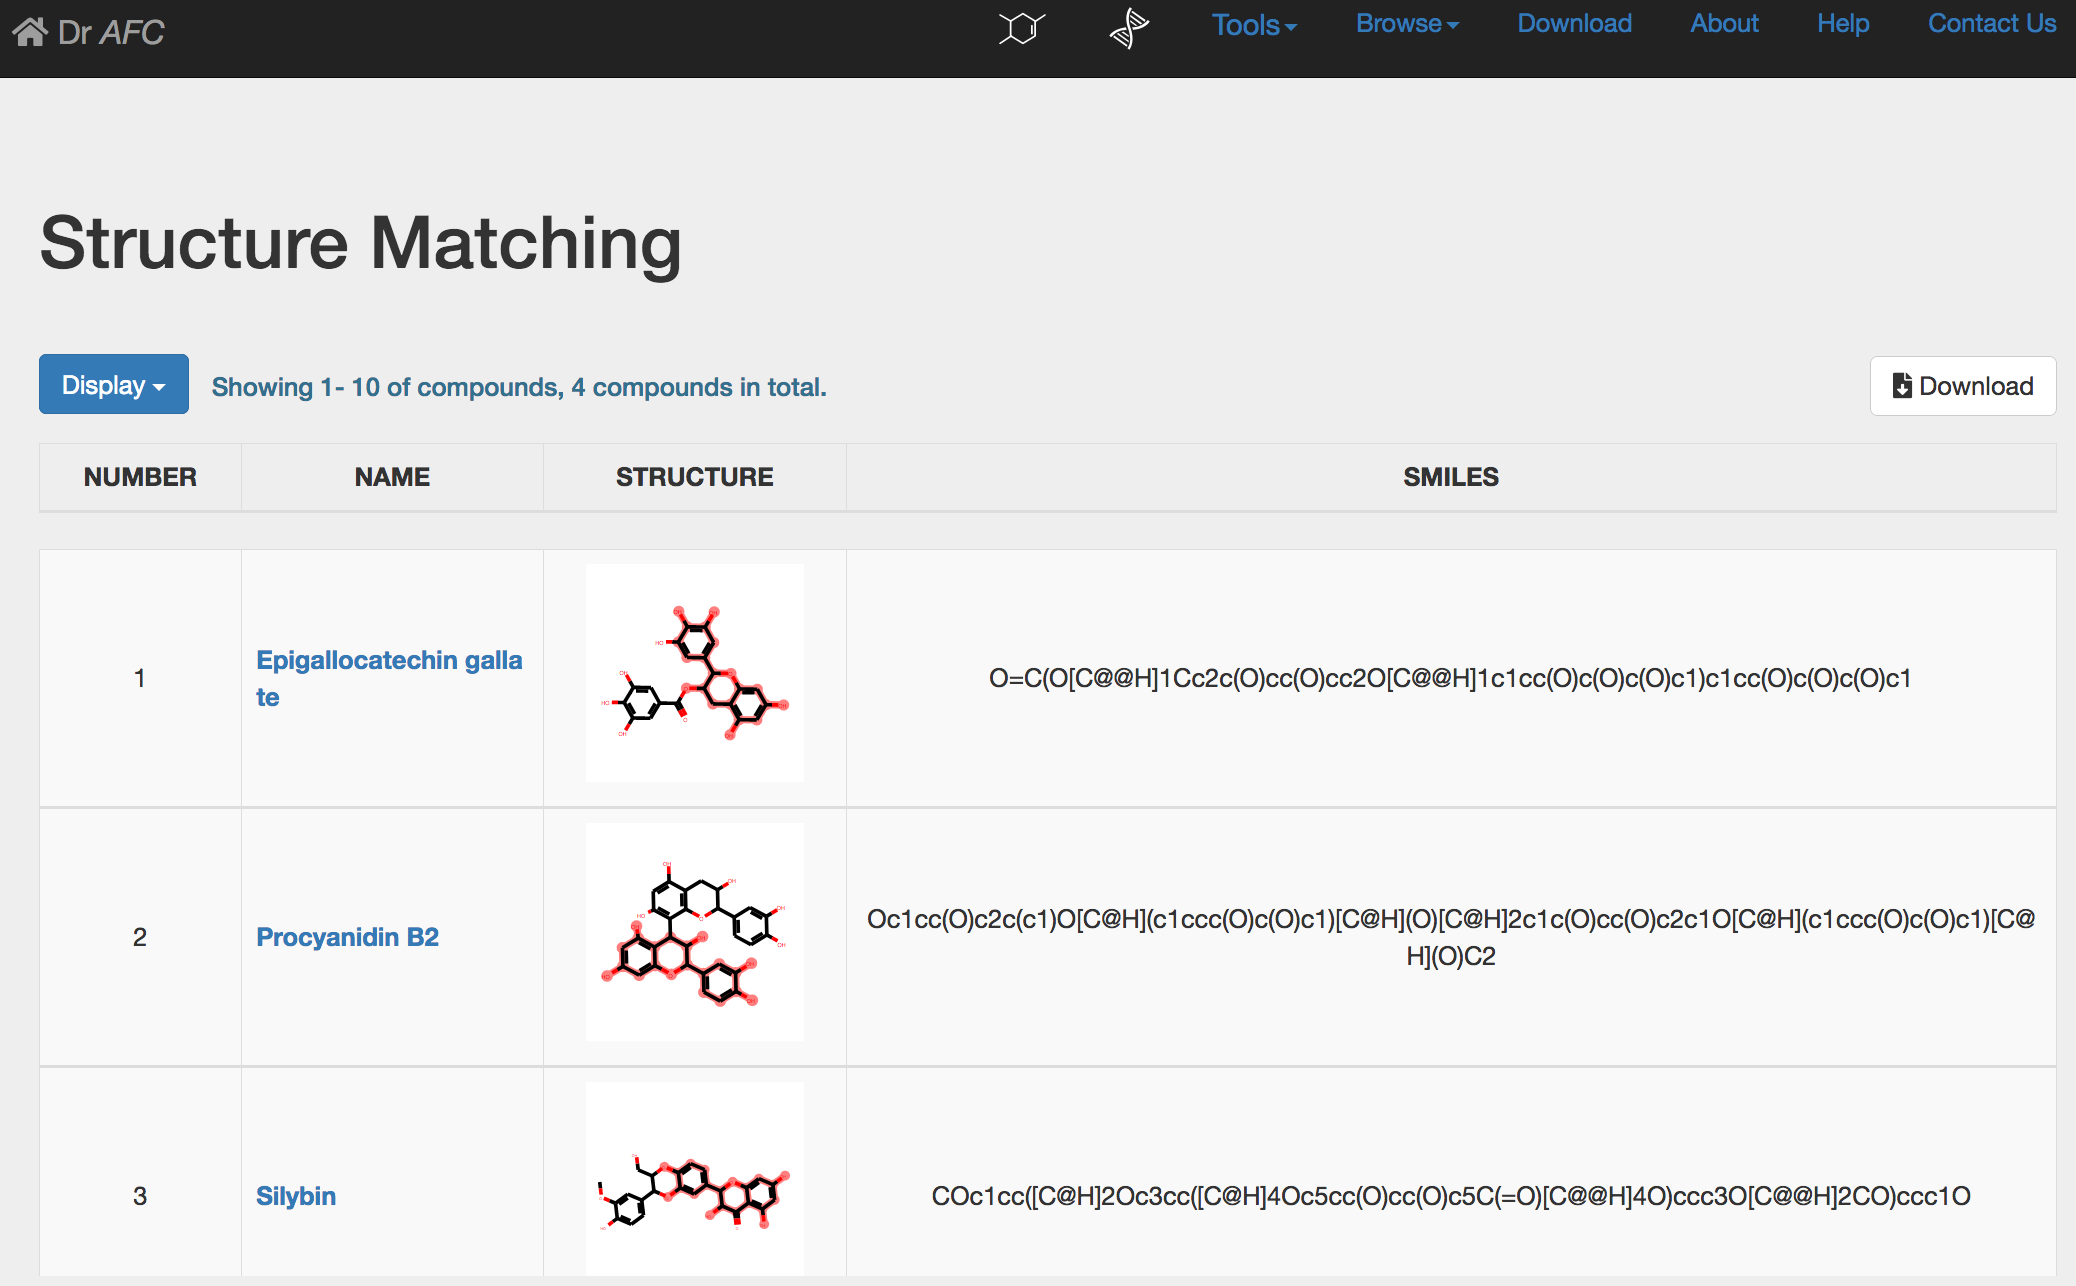
If single compound is submitted, Structure Matching could automatically perform similarity calculation and return a result page. The calculation result will be displayed in a four-column table.
NUMBER: compound ranked by similarity score.
NAME: retrieved compound name from the Anti-fibrosis Knowledge Base.
STRUCTURE: the 2D chemical structure generated by SMILES string. In Substructure Search, the submitted structures are highlighted in red. Users could click the picture to zoom in the chemical structure in a new page.
SMILES: the SMILES string of compound.
If multiple compounds are submitted, Structure Matching would return a different result page. The calculation result will be displayed in a five-column table.
NAME: compound name.
COMPOUND 1: the first compound name ranked by similarity score in the Anti-fibrosis Knowledge Base.
(As COMPOUND 1, COMOUND 2-5 refer to the corresponding ranked compounds)
TOTAL: the total number of retrieved compounds in Anti-fibrosis Knowledge Base.
As before, two different Structure Matching result tables could display first 10, 50 or 100 compounds through setting the Display drop-down list. Users could click the Download button to download the entire matching result. The downloaded file is a text file separated by Tab. The downloaded file columns are the same as the displayed table. Please see section 2.
1. Davis, A.P., et al., The Comparative Toxicogenomics Database: update 2019. Nucleic Acids Res, 2019. 47(D1): p. D948-D954.
2. Zarin, D.A., et al., 10-Year Update on Study Results Submitted to ClinicalTrials.gov. N Engl J Med, 2019. 381(20): p. 1966-1974.
3. Wishart, D.S., et al., DrugBank 5.0: a major update to the DrugBank database for 2018. Nucleic Acids Res, 2018. 46(D1): p. D1074-D1082.
4. Bickerton, G.R., et al., Quantifying the chemical beauty of drugs. Nat Chem, 2012. 4(2): p. 90-8.
5. Landrum, G., RDKit: Open-source cheminformatics. 2006.