Overview of MPA
1. Overview
MPA (Mycobacteriaceae Phenome Atlas, https://www.biosino.org/mpa/)
is a Mycobacteriaceae phenome database, which integrates the phenomic data of
Mycobacteriaceae strains by literature mining, third-party database integration, and
bioinformatics annotation. The phenotypes of Mycobacteriaceae are inferred from
available phenomic data, and 82 microbial phenotypic traits were recruited as data
elements of the microbial phenome, containing 5 categories and 20 subcategories of
polyphasic phenotypes, and 3 categories and 8 subcategories of functional
phenotypes, all of which are complementary to the existing data standards of
microbial phenotypes. The phenotypes were searchable and comparable from the website
of MPA. A network analysis of MPA topological data revealed the co-evolution between
Mycobacterium tuberculosis and some important phenotypes, such as virulence factors,
and also uncovered potential pathogenicity-associated phenotypes. The application of
MPA may provide novel insights into the pathogenicity mechanism of Mycobacteriaceae.
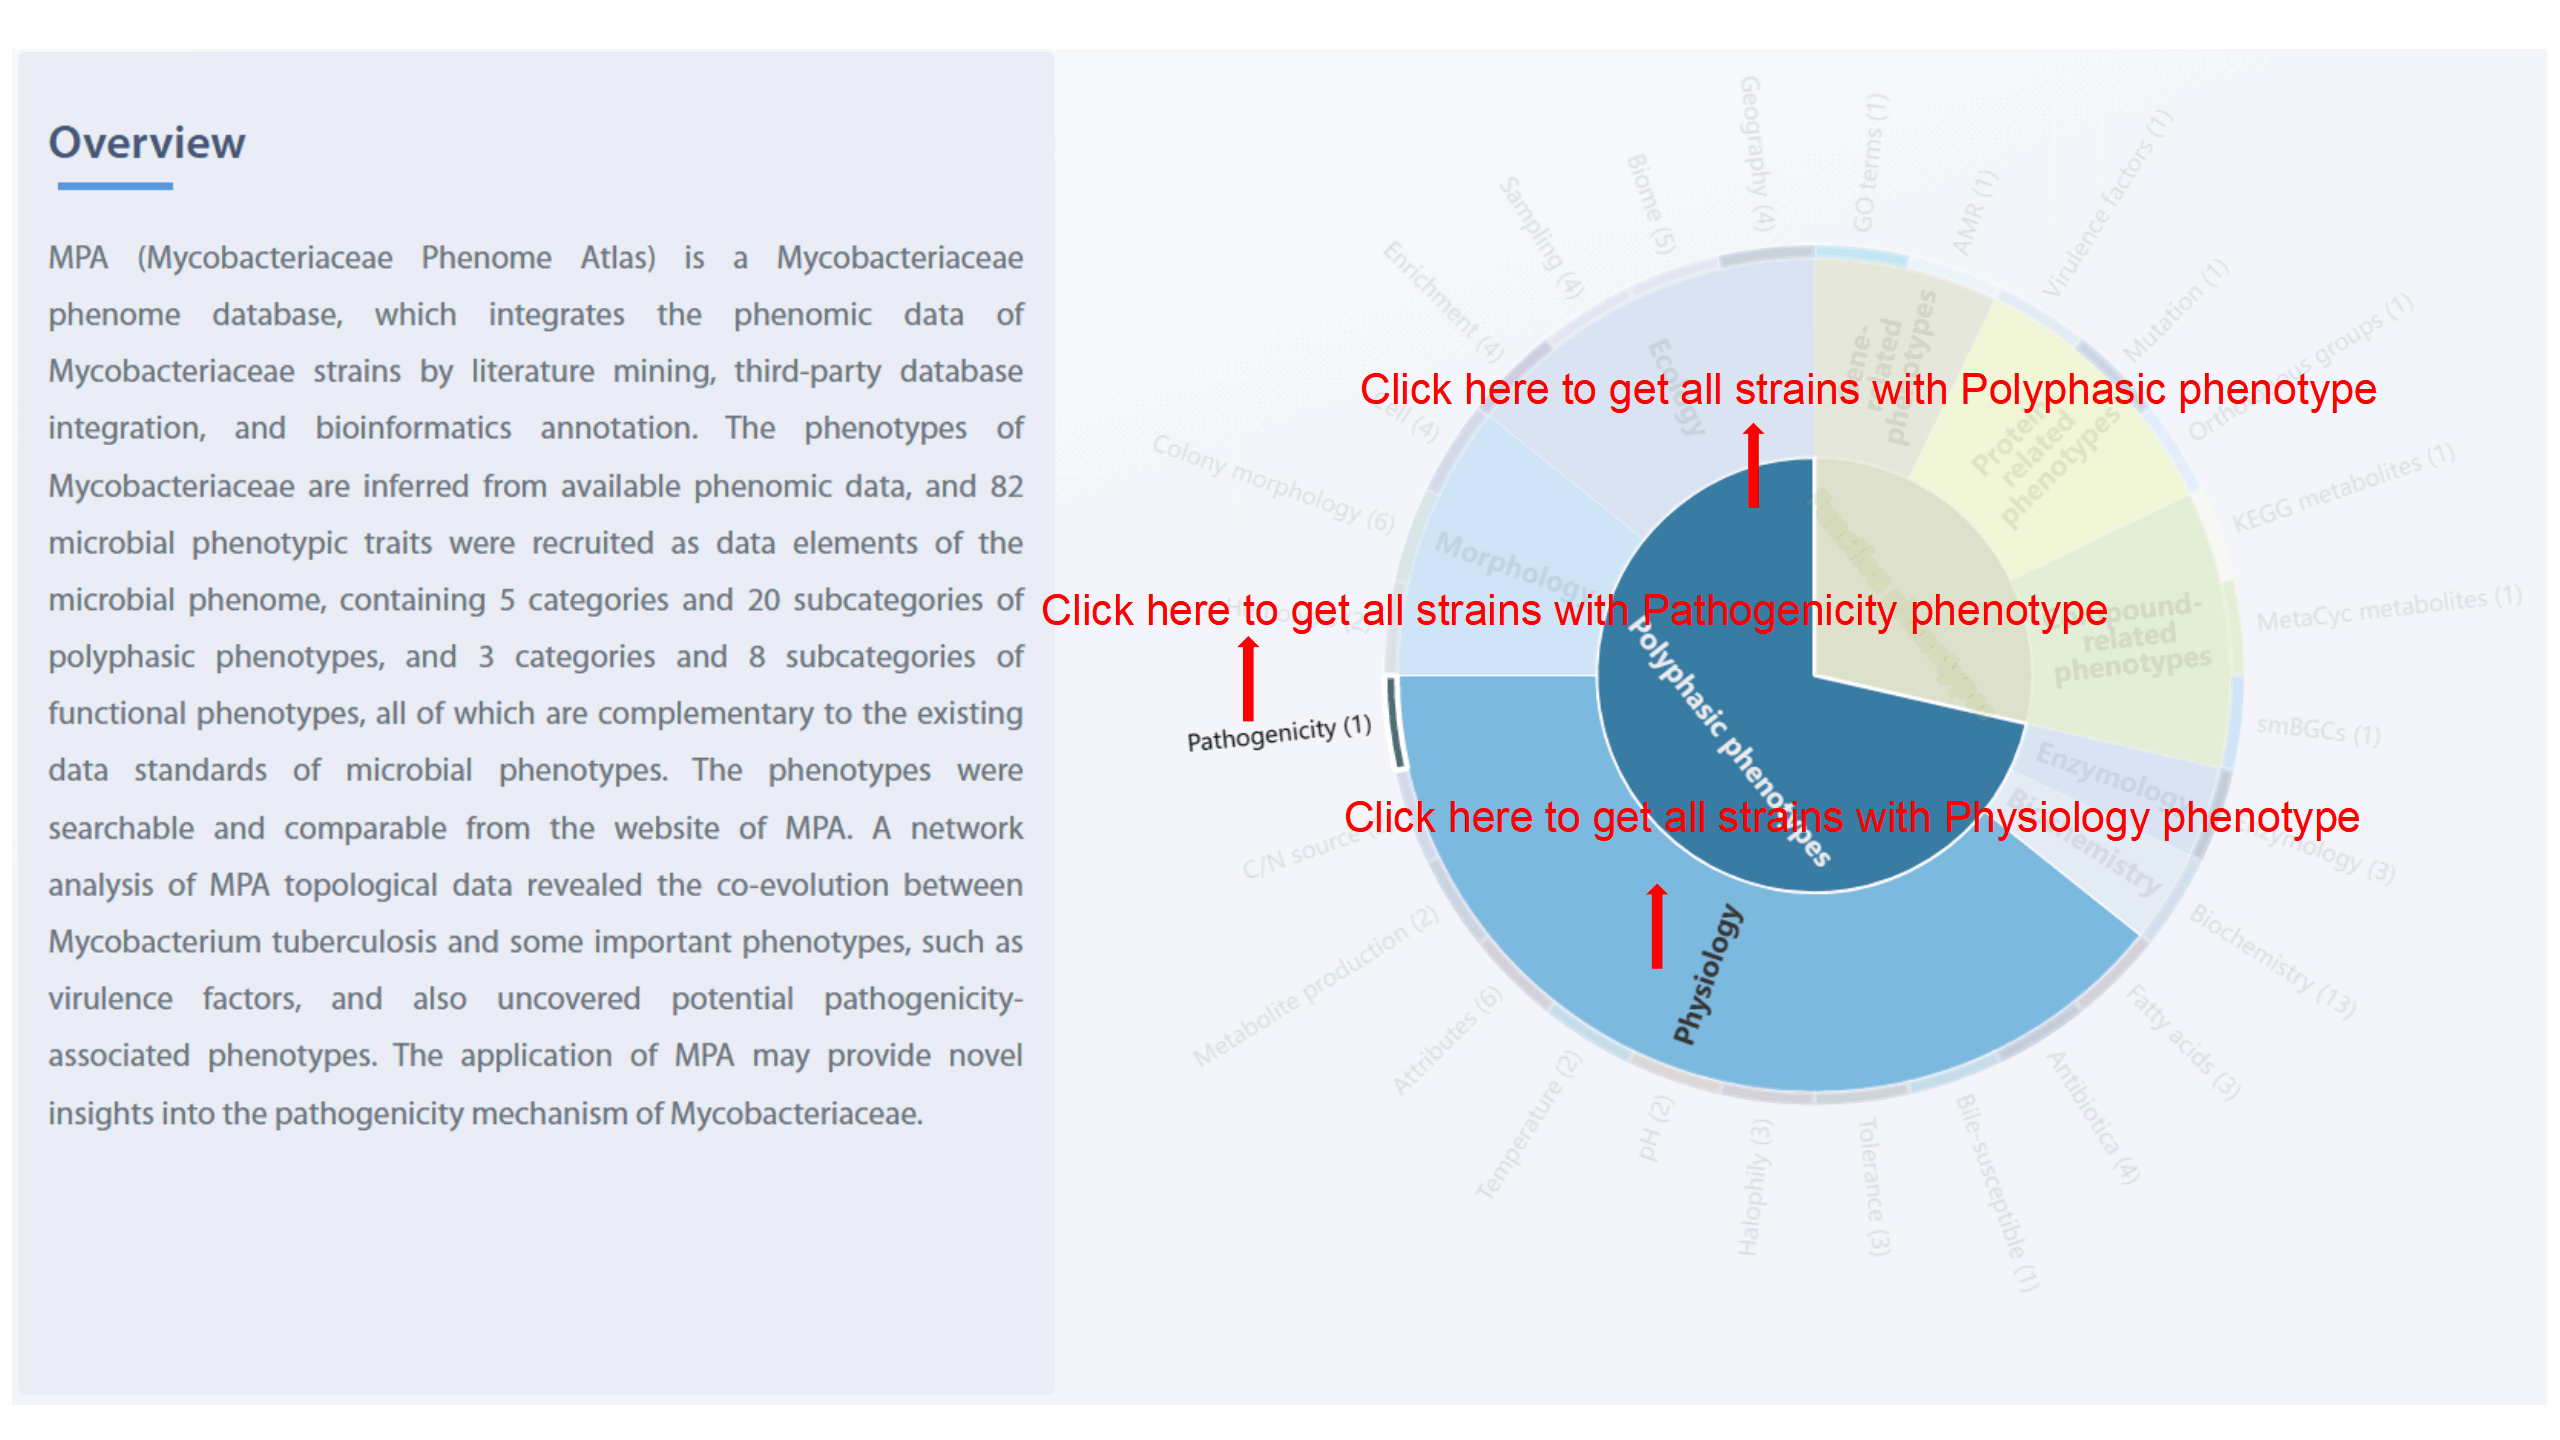
2. Summary of data elements in MPA.
The sunburst chart shows the three levels of data elements in MPA. Levels I and II
indicate the name of categories, and Level III refers to the name of 28
subcategories and the number of embodied phenotypes. Level I includes “Polyphasic
phenotypes” and “Functional phenotypes.” Level II contains “Ecology,” “Morphology,”
“Physiology,” “Biochemistry,” “Enzymology,” “Gene-related phenotypes,”
“Protein-related phenotypes,” and “Compound-related phenotypes.” Level III consists
of “Geography,” "Biome,” "Sampling,” “Enrichment,” “Cell,” "Colony morphology,”
"Hemolysis,” “C/N source,” "Metabolite production,” "Attributes,” "Temperature,”
"pH,” "Halophily,” “Tolerance,” "Bile-susceptible,” "Antibiotica,” "Fatty
acids,””Pathogenicity,” "Biochemistry,” "Enzymology,” "GO terms,” "AMR,” "Virulence
factors,” "Amino acid mutations,” "Orthologous groups,” "KEGG metabolites,” "MetaCyc
metabolites,” and "smBGCs." User can jump to browse page of strains list with
corresponding phenotypes by clicking each level of the sunburst chart.
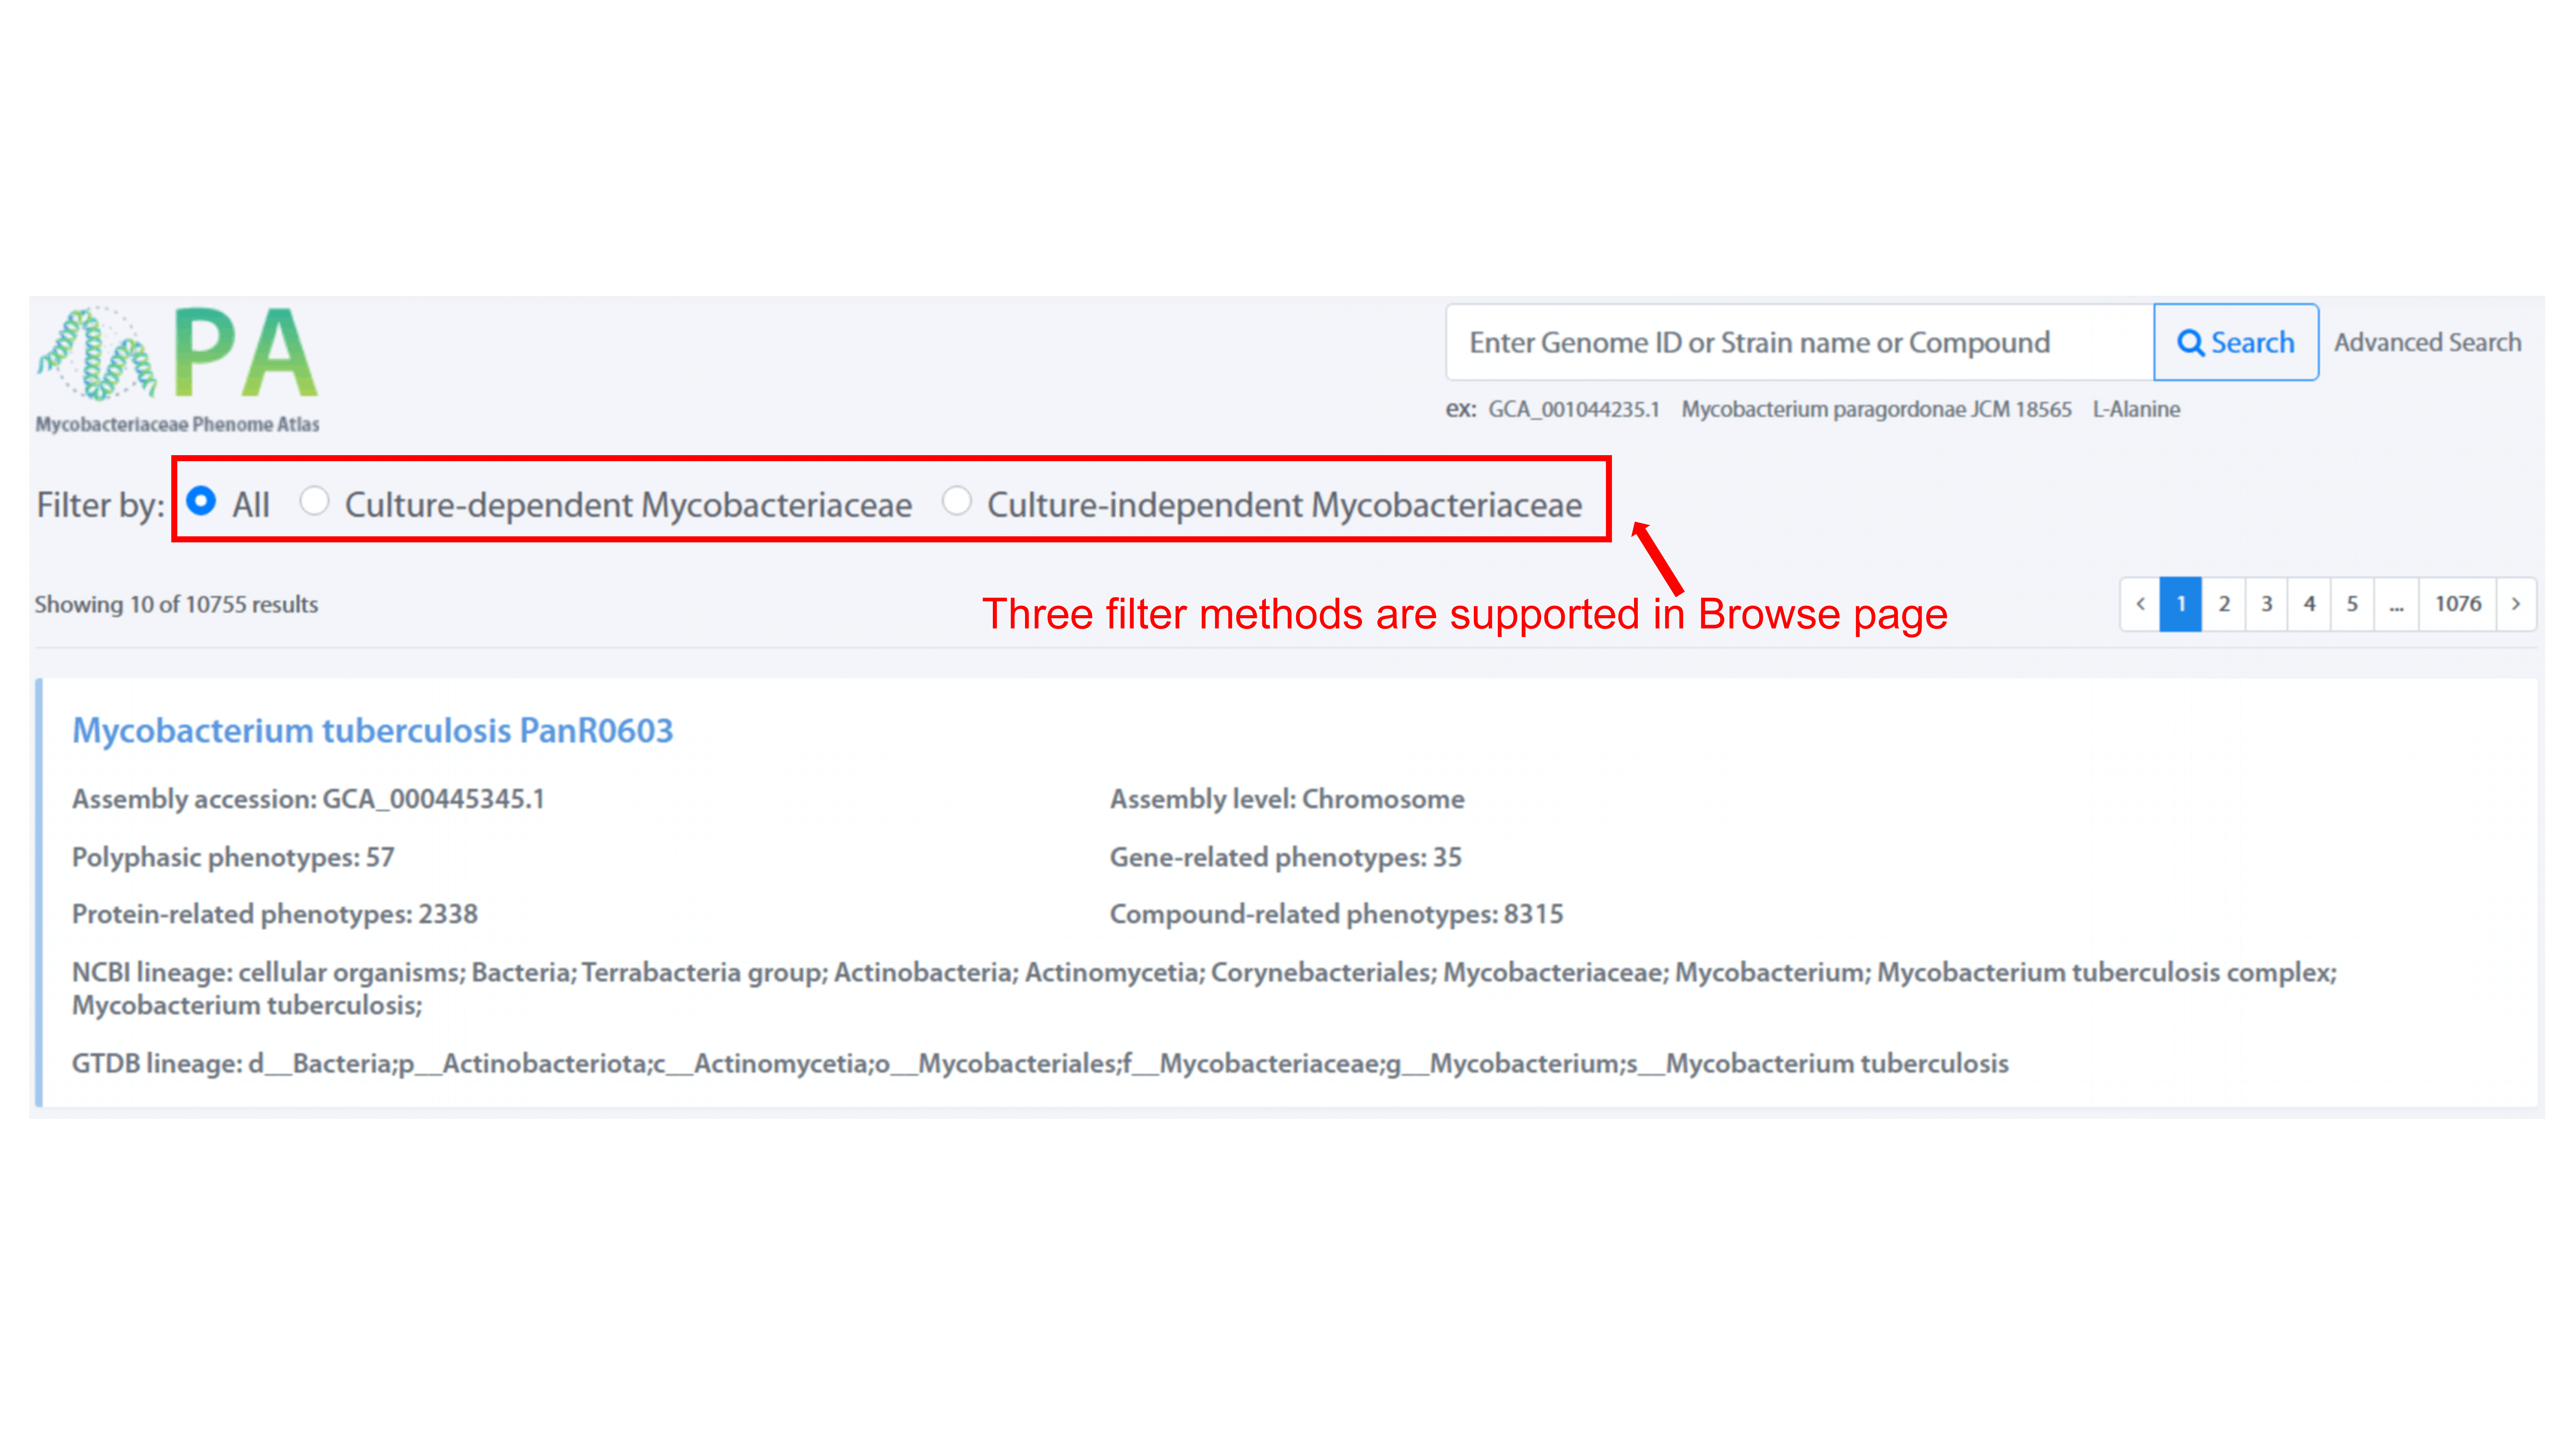
Browse Database
Three filter methods, including All, Culture-dependent Mycobacteriaceae, and
Culture-independent Mycobacteriaceae, are provided to filter the strain of interests
in Browse page. User can view the detail of each strain by clicking strain name.
Search Database
Simple search and advanced search are both provided in the MPA server. Simple search
supports fuzzy queries by inputting species name, genome id, or compound name, while
advanced search offers large-scale sophisticated queries, where maximum 23 terms can
be combined searched.
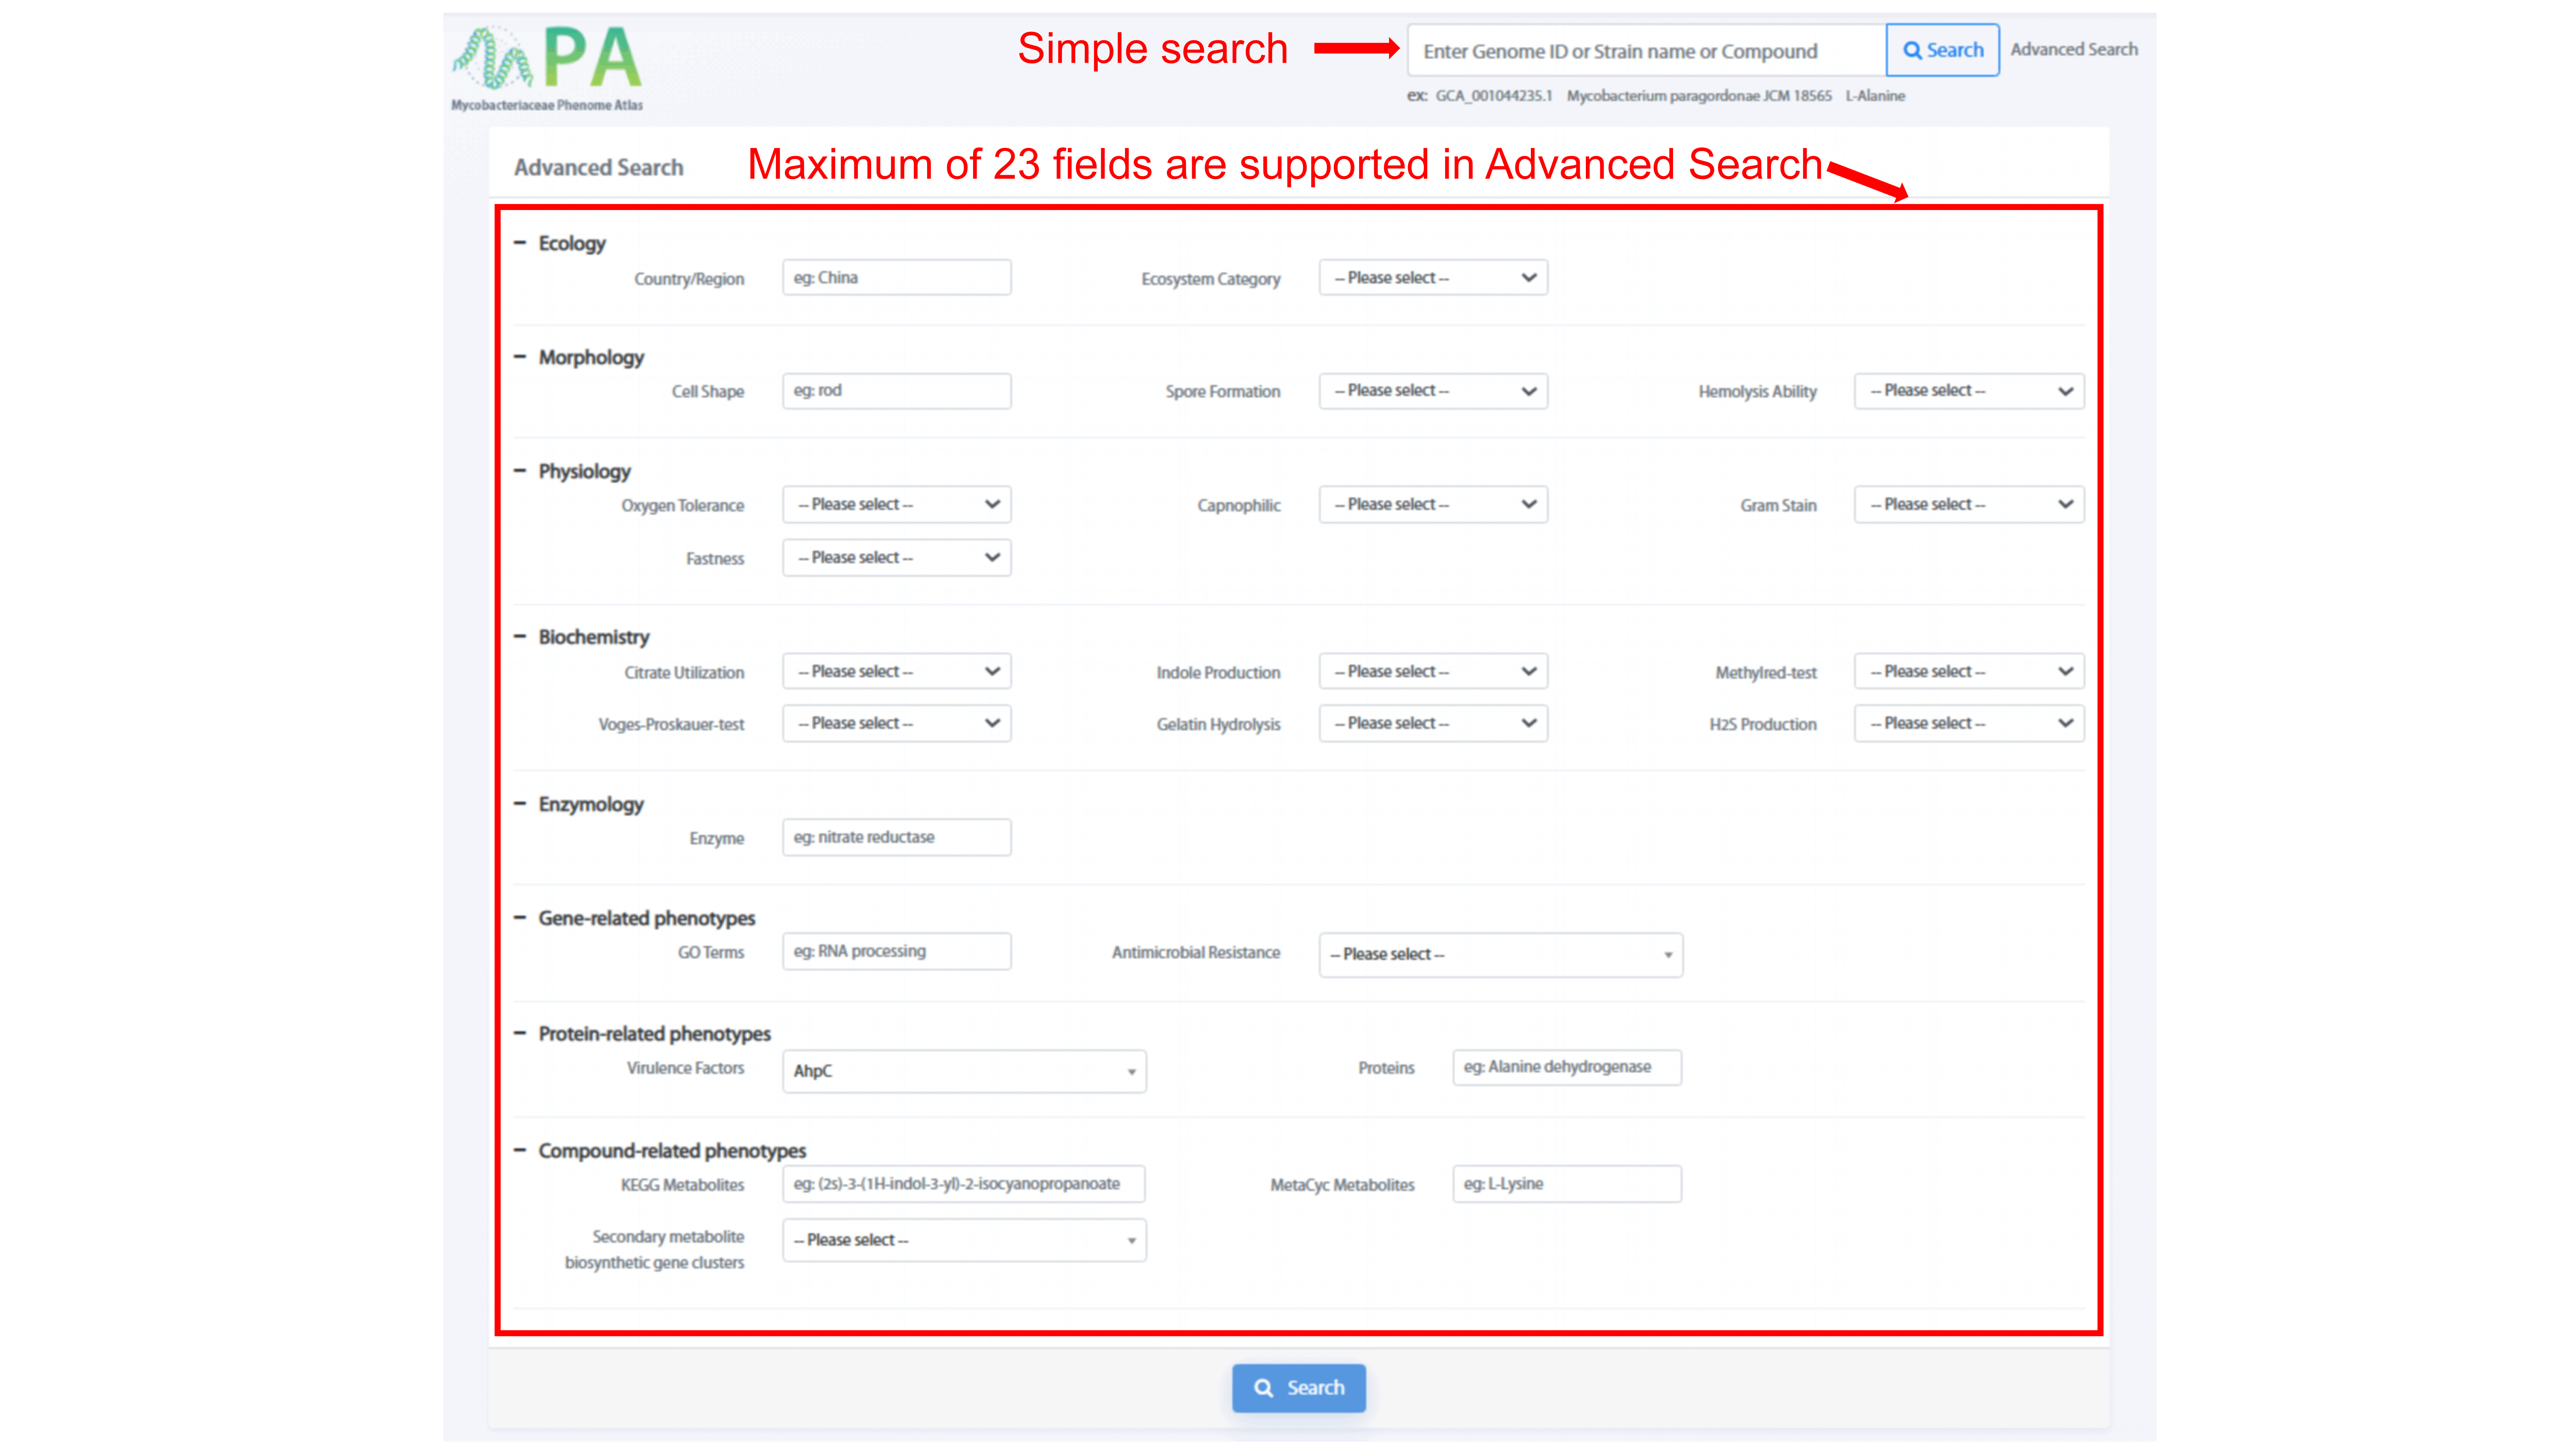
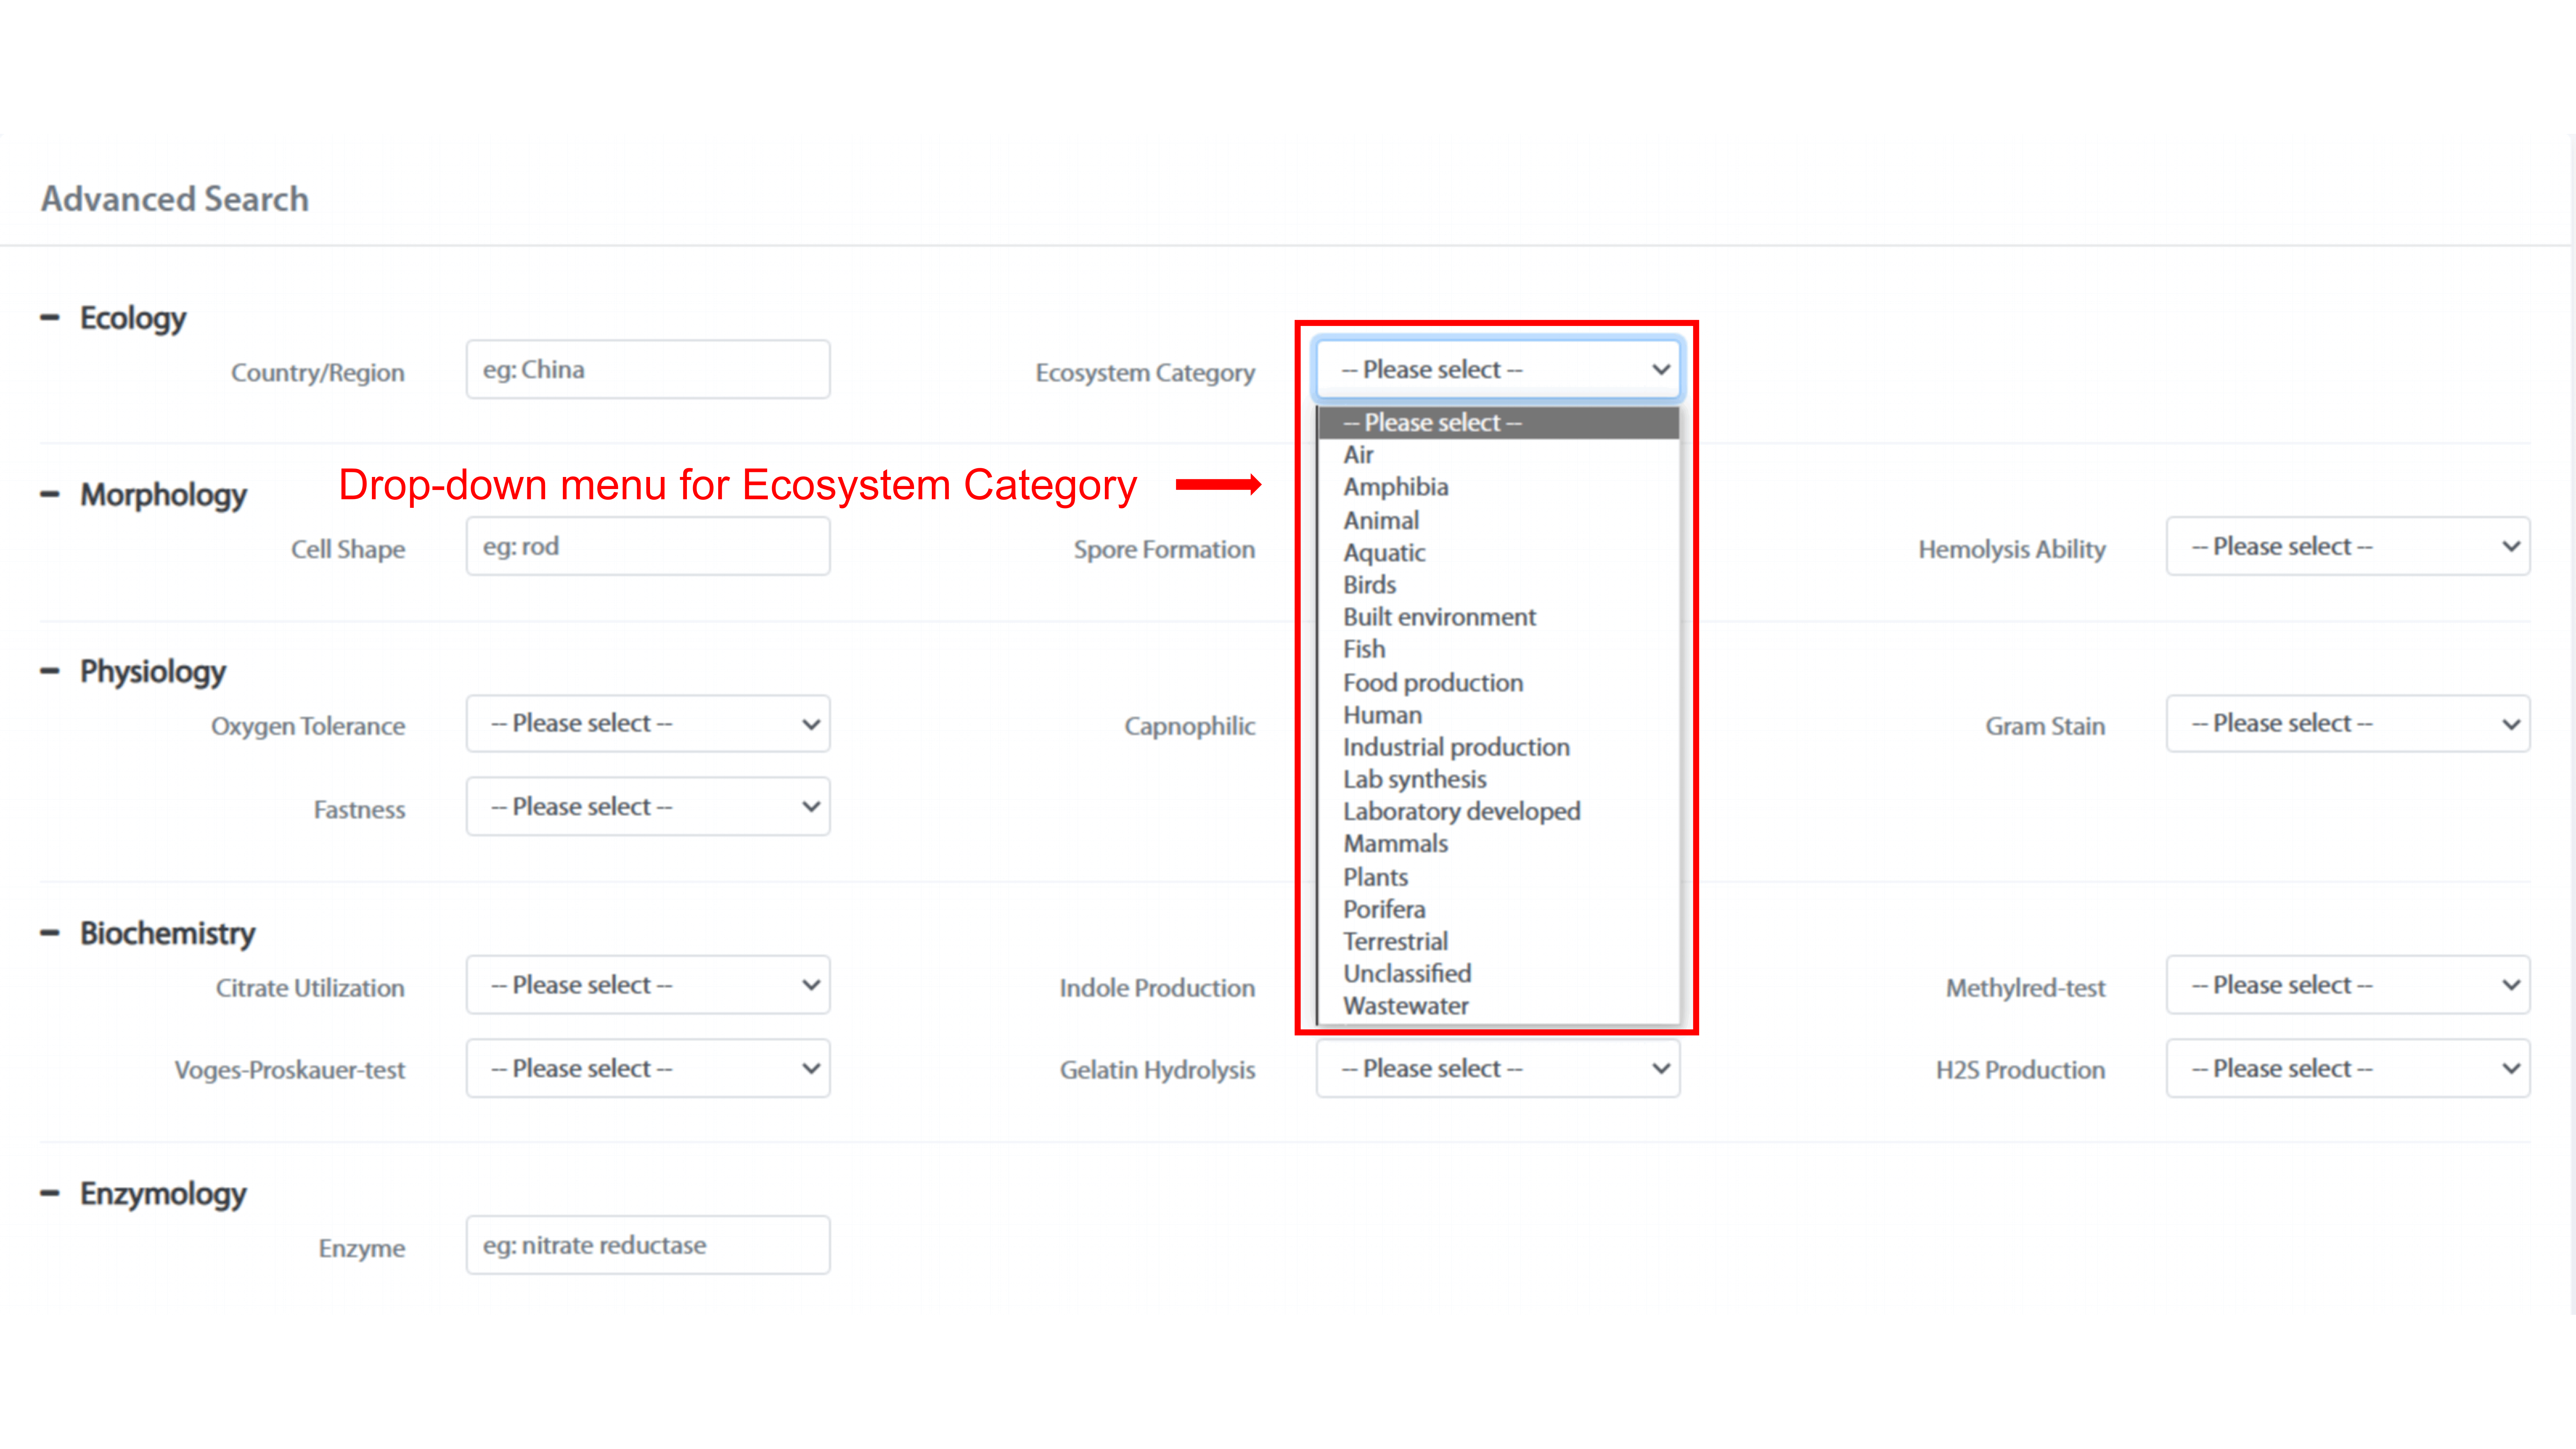
"Advanced Search" page allows user to search for phenotypes of maximum 23 fields by
using “AND”. Phenotypic traits, such as “Ecosystem Category,” “Spore Formation,” and
“Hemolysis Ability” have drop-down menu, user can search for the phenotype of
interest. The rest phenotypes, such as “Country/Region,” “Cell Shape,” and “Enzyme”
support fuzzy search.
Strain Detail View
There are seven sections in the detail page of strain, including Overview,
Polyphasic phenotypes, Gene-related phenotypes, Protein-related phenotypes,
Compound-related phenotypes, Gene, and References.
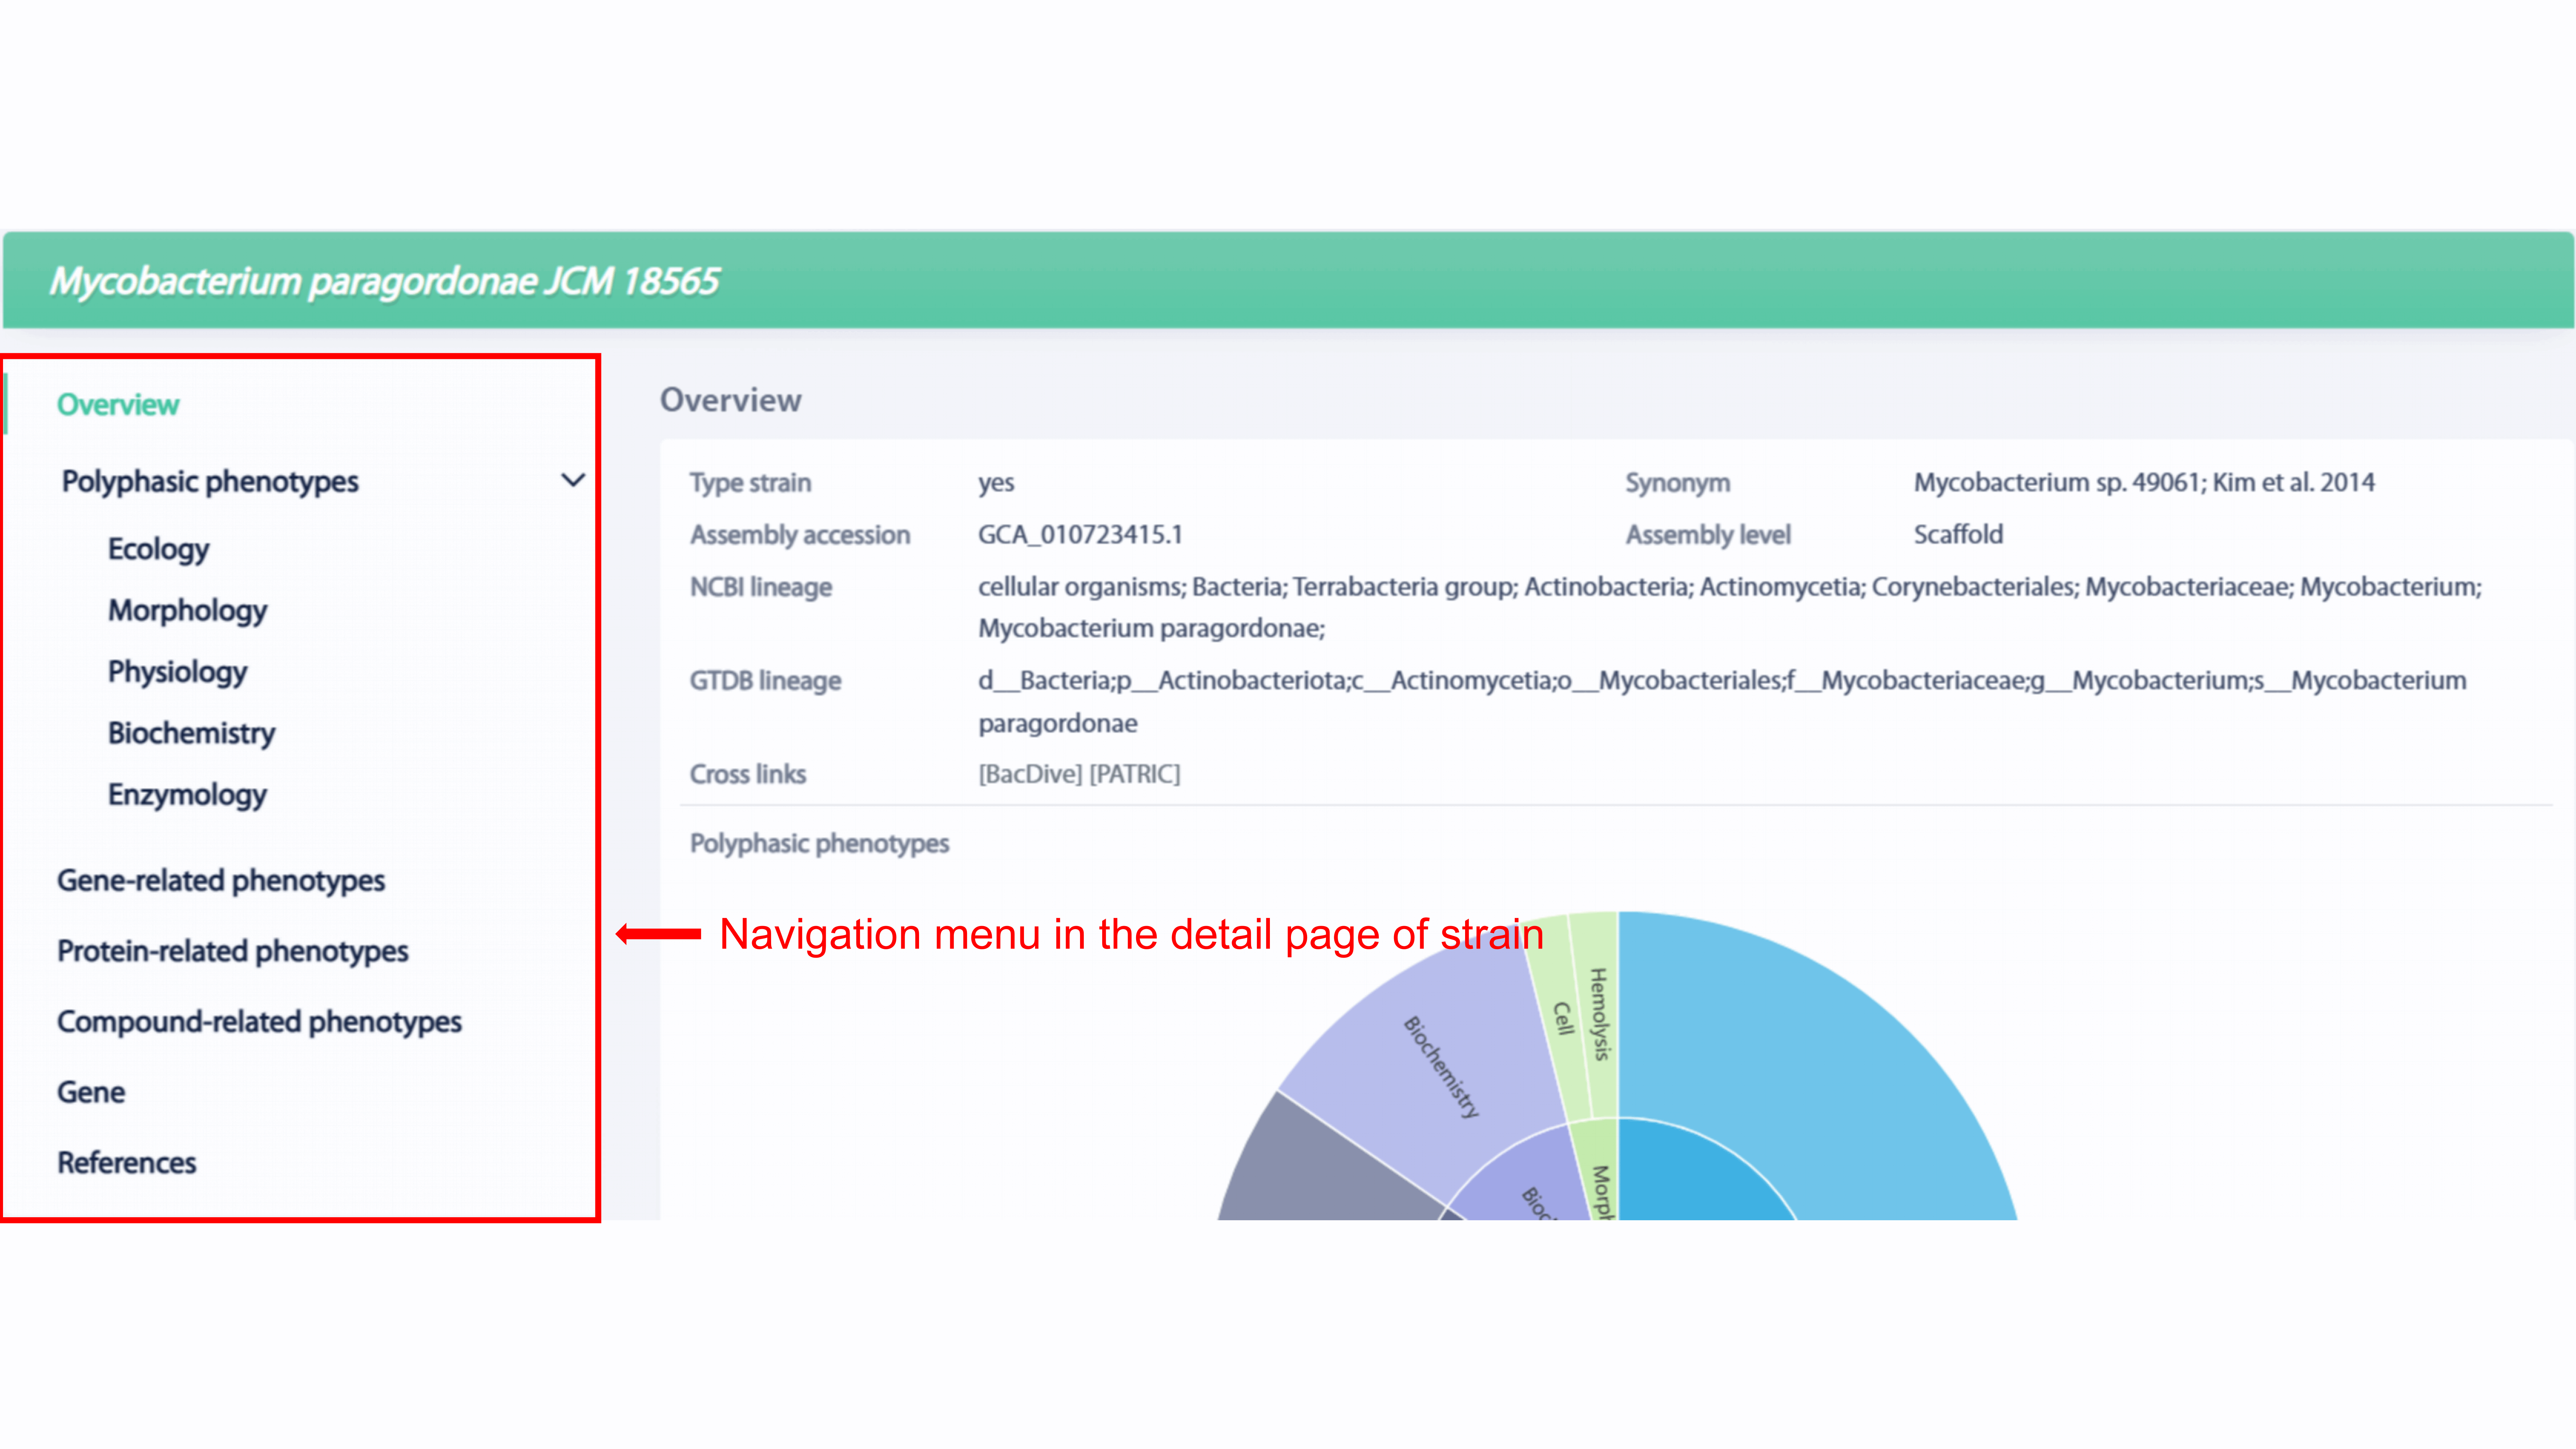
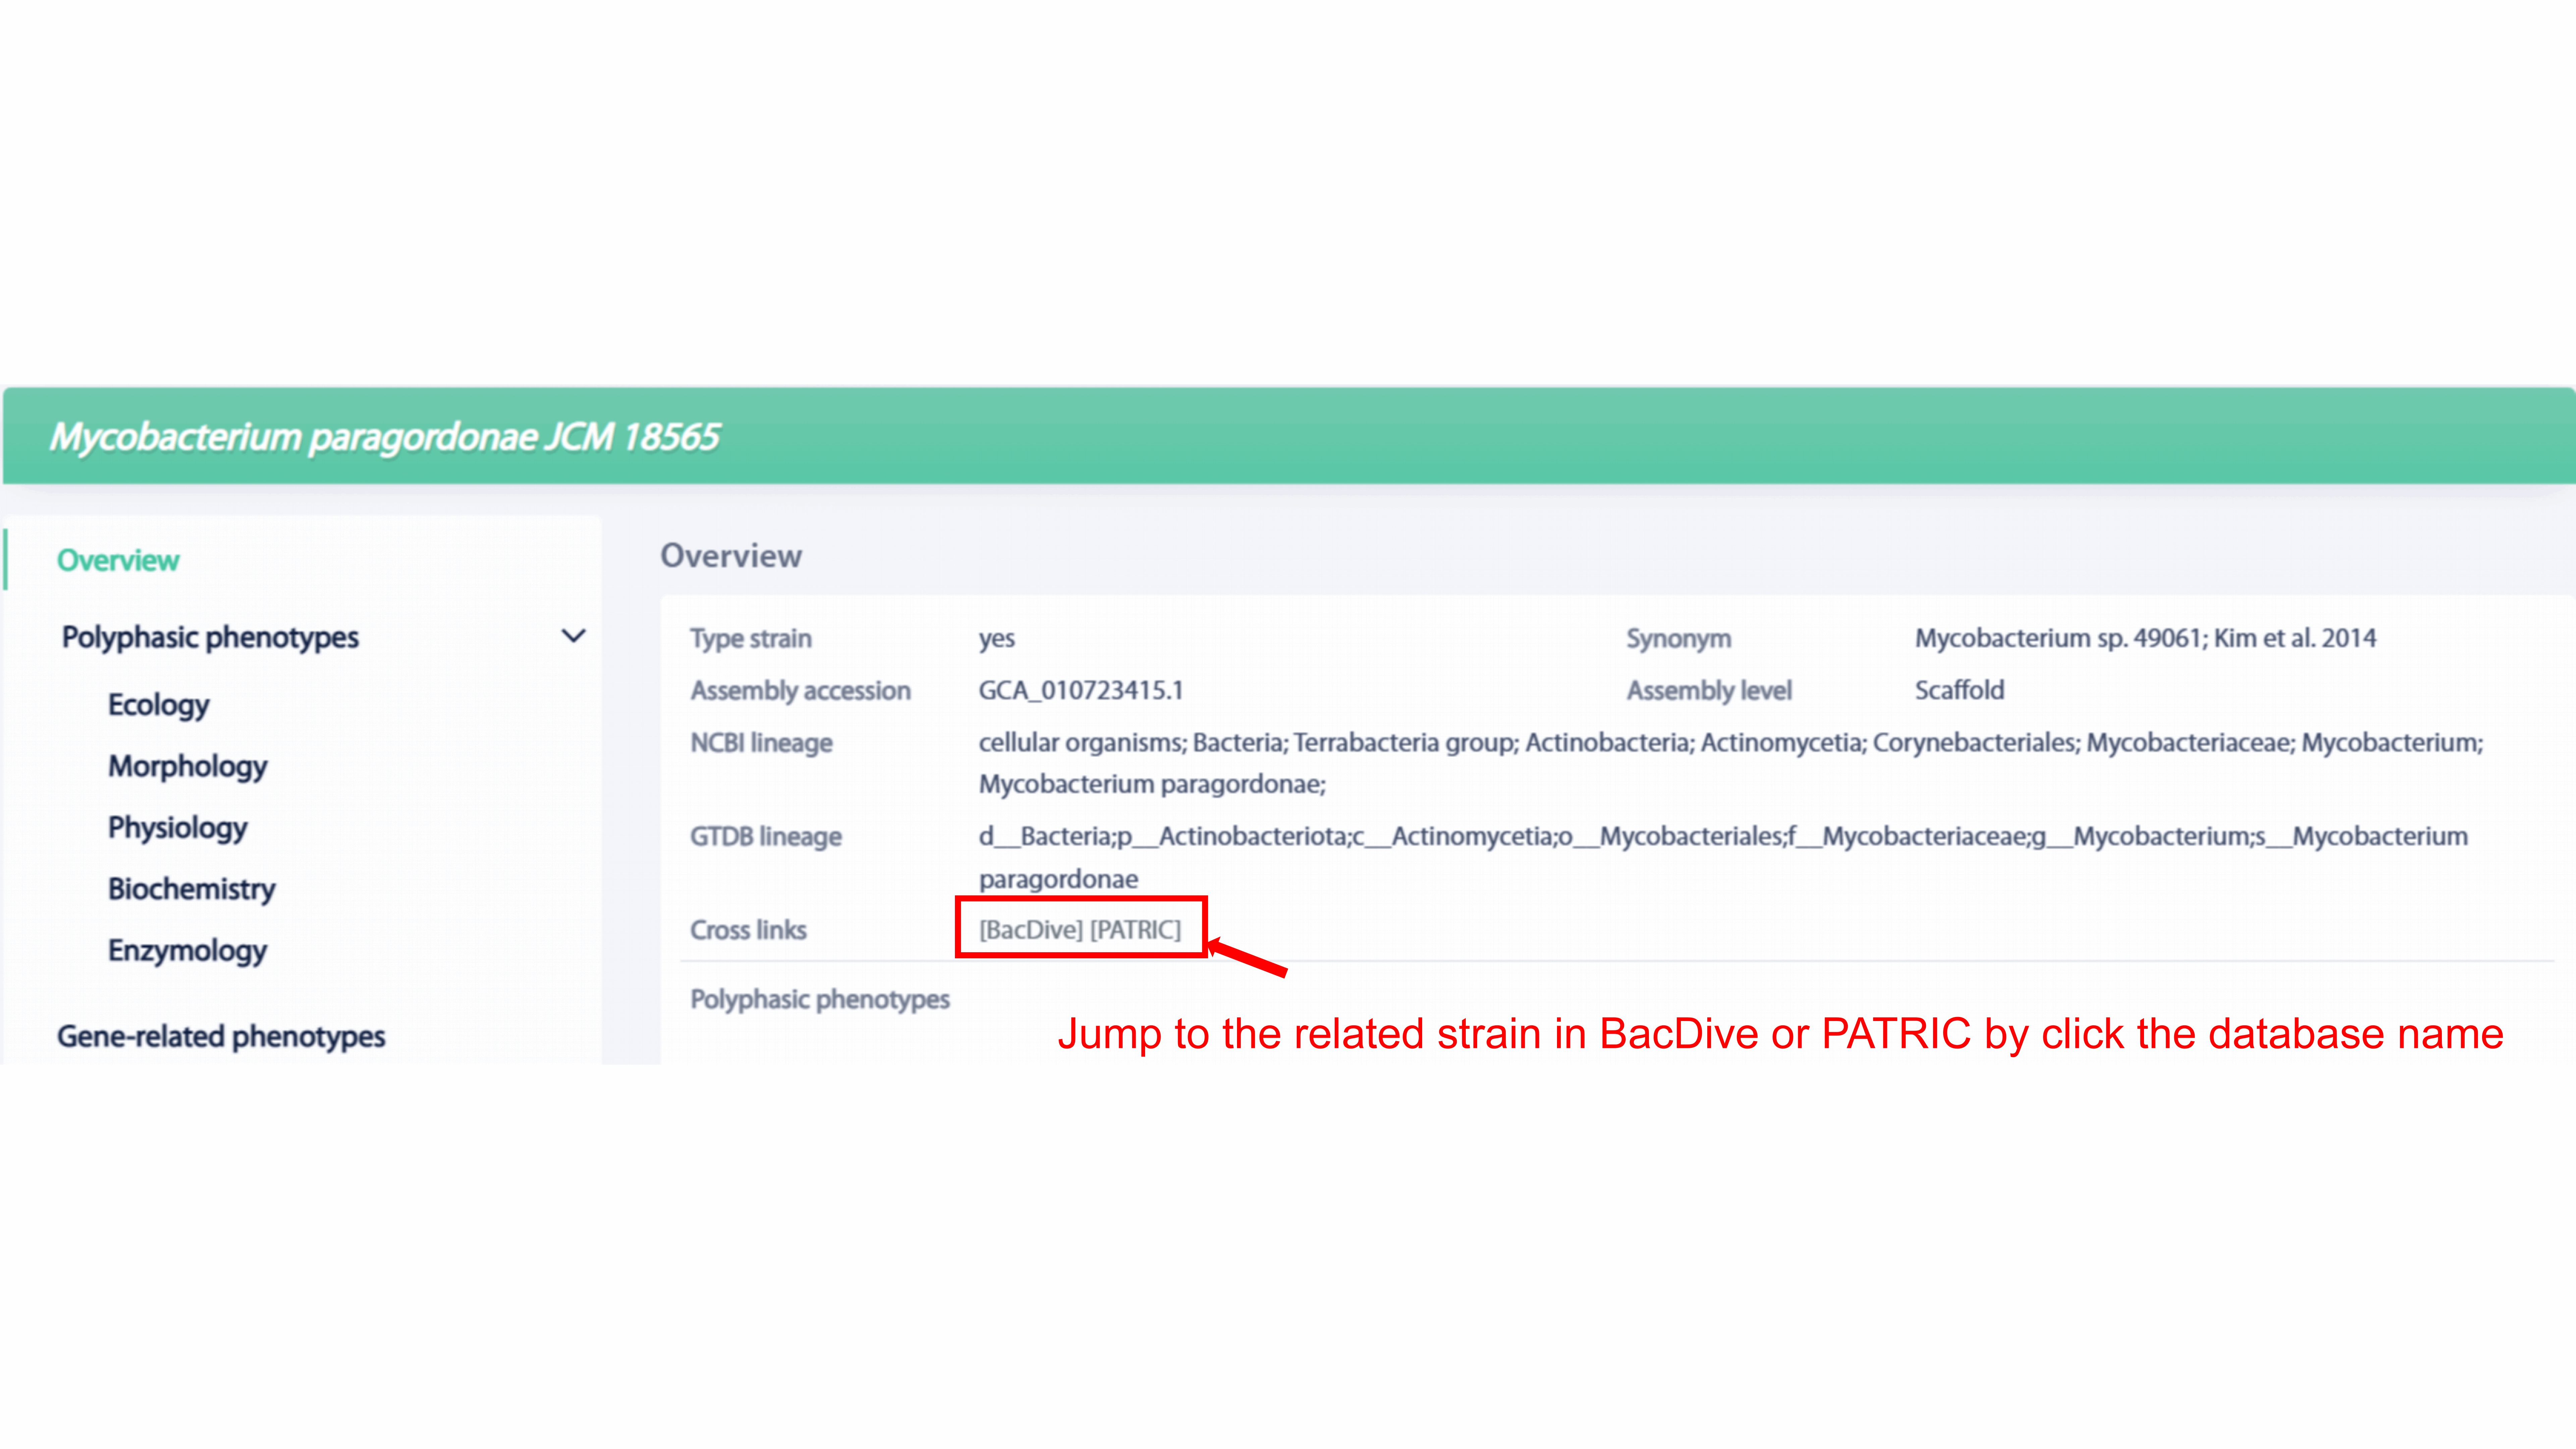
Information, including type strain, assembly accession, assembly level, NCBI
lineage, GTDB lineage, statistics of polyphasic phenotypes, statistics of functional
phenotypes and so on, is provided in the overview section. User can go to the
related strain in BacDive or PATRIC by click the database name in cross links.
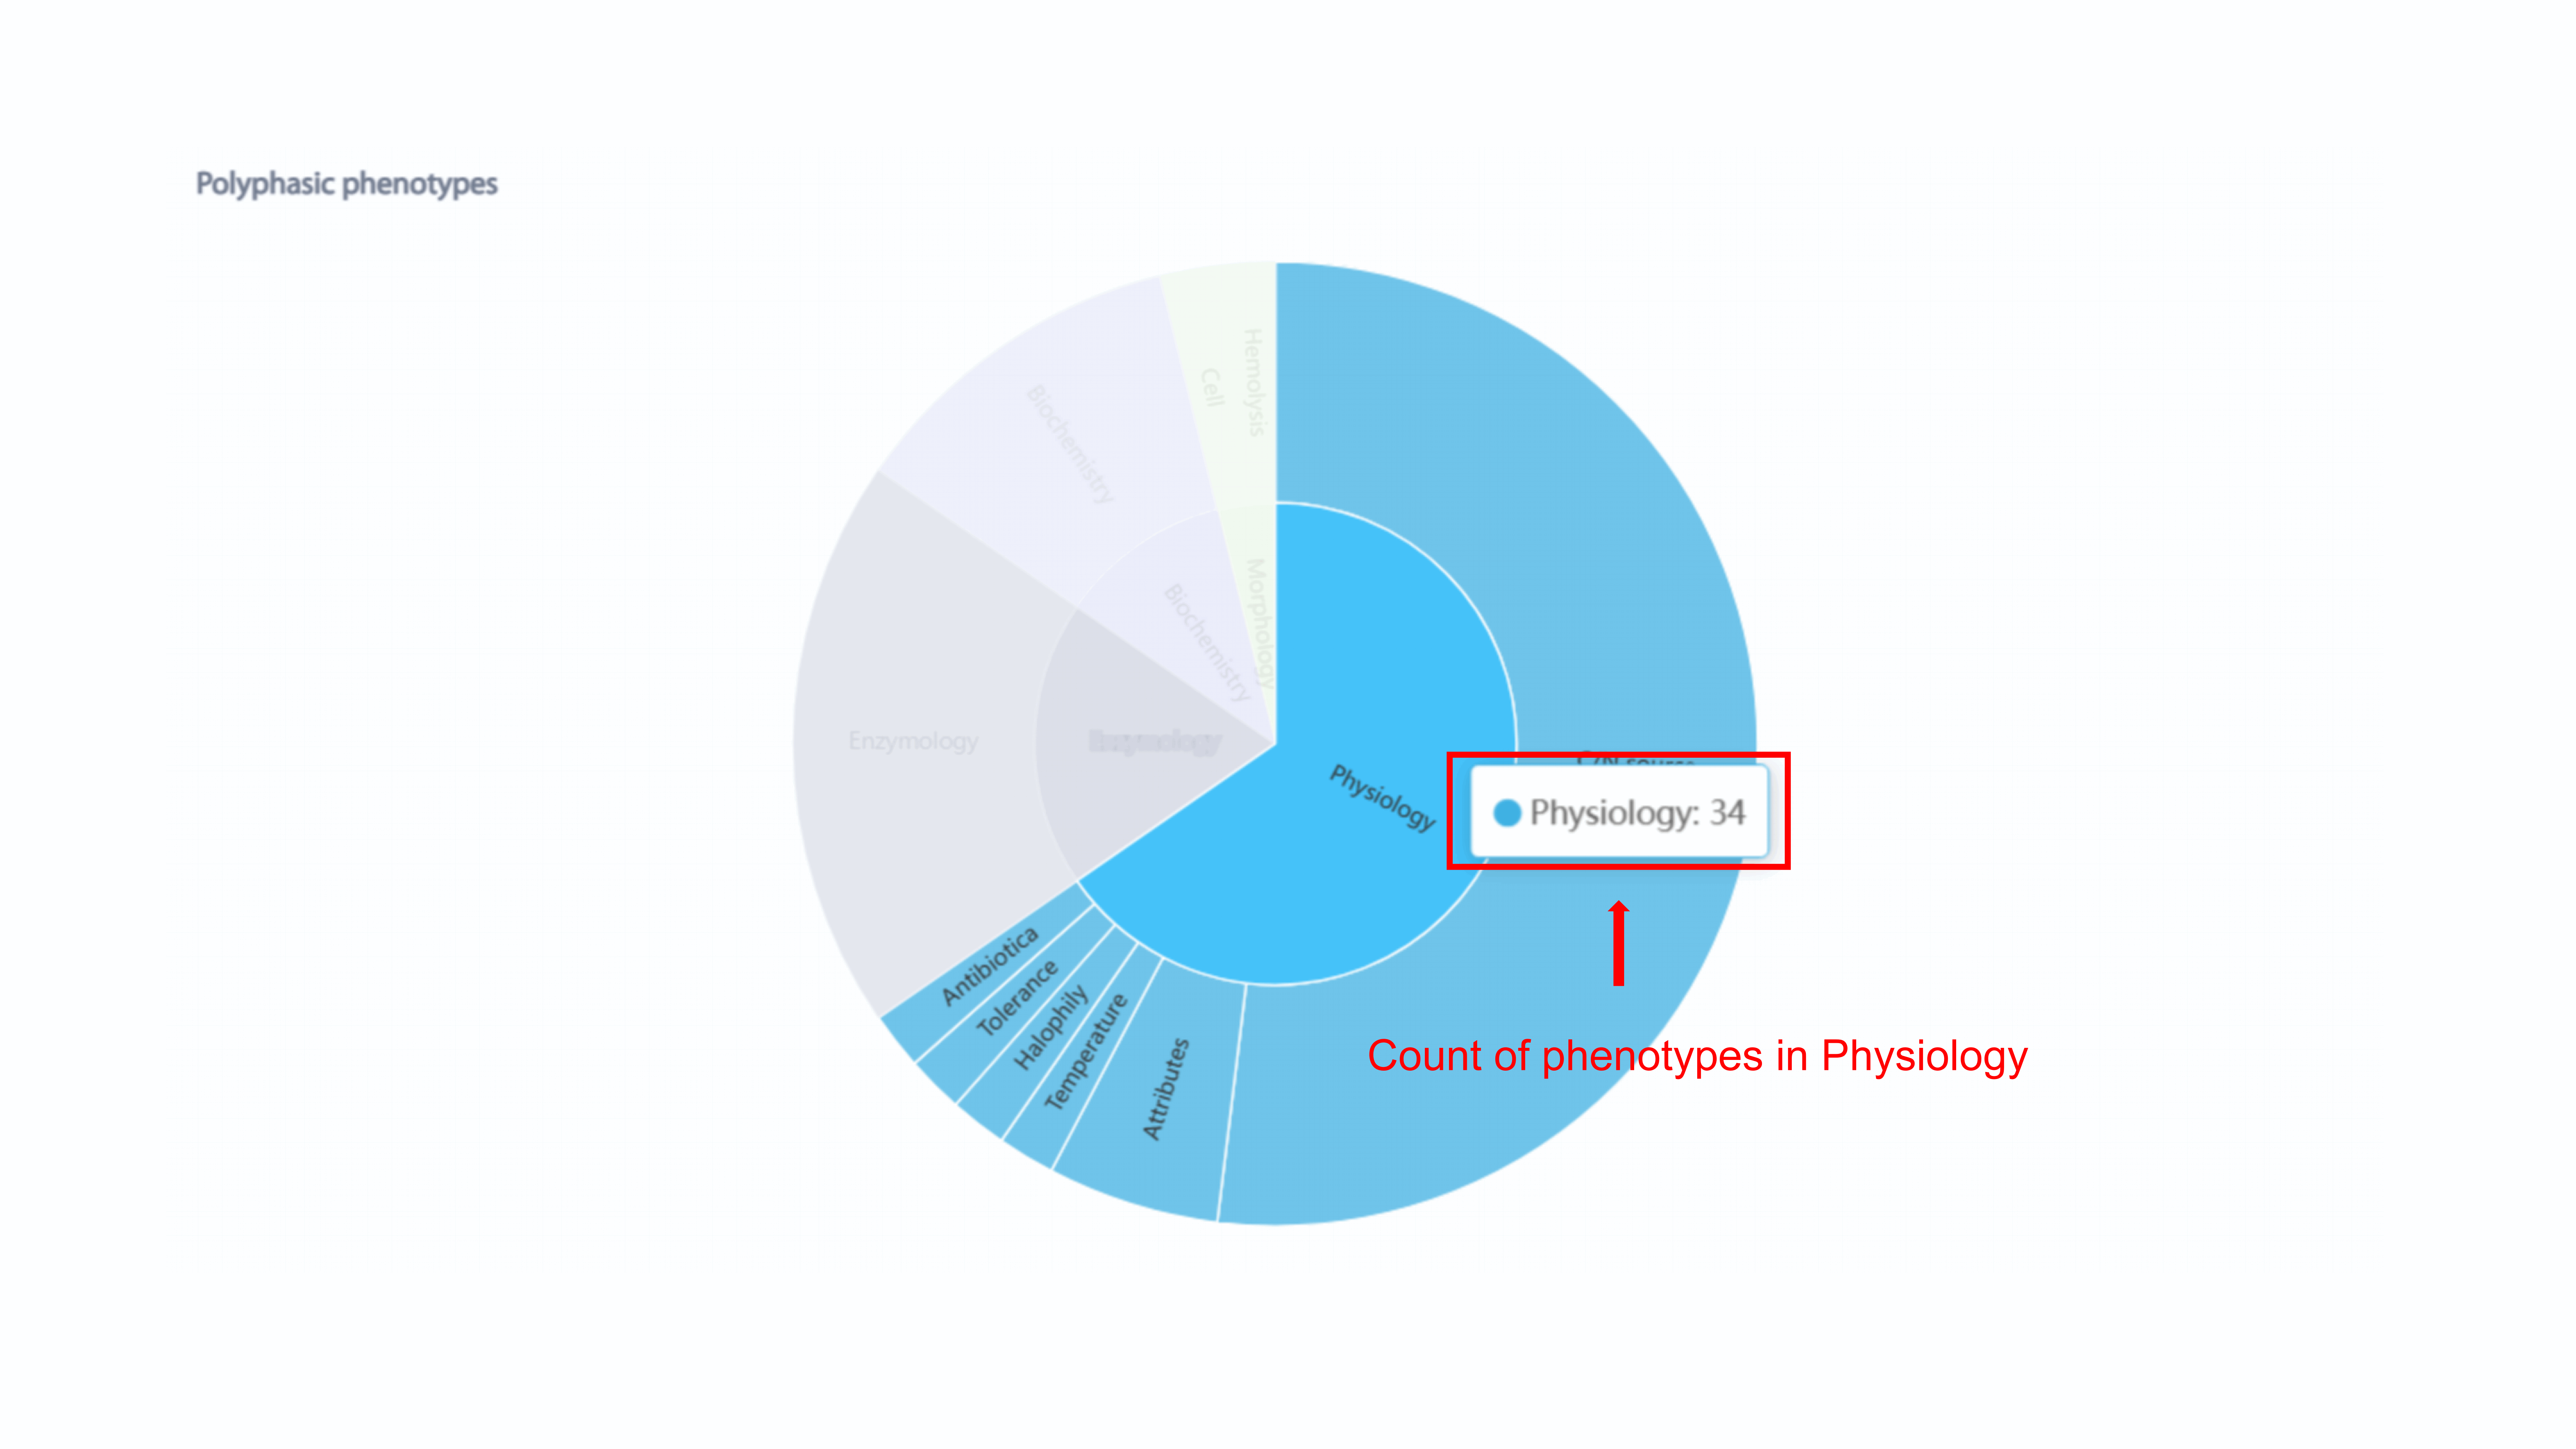
MPA shows the statistics of both polyphsic phenotypes and functional phenotypes in
overview section. The sunburst chart for the statistics of polyphsic phenotypes
shows proportion of phenotypes of each strain. If user put the mouse above the
phenotype of interest, the count of phenotype in this part will be shown.
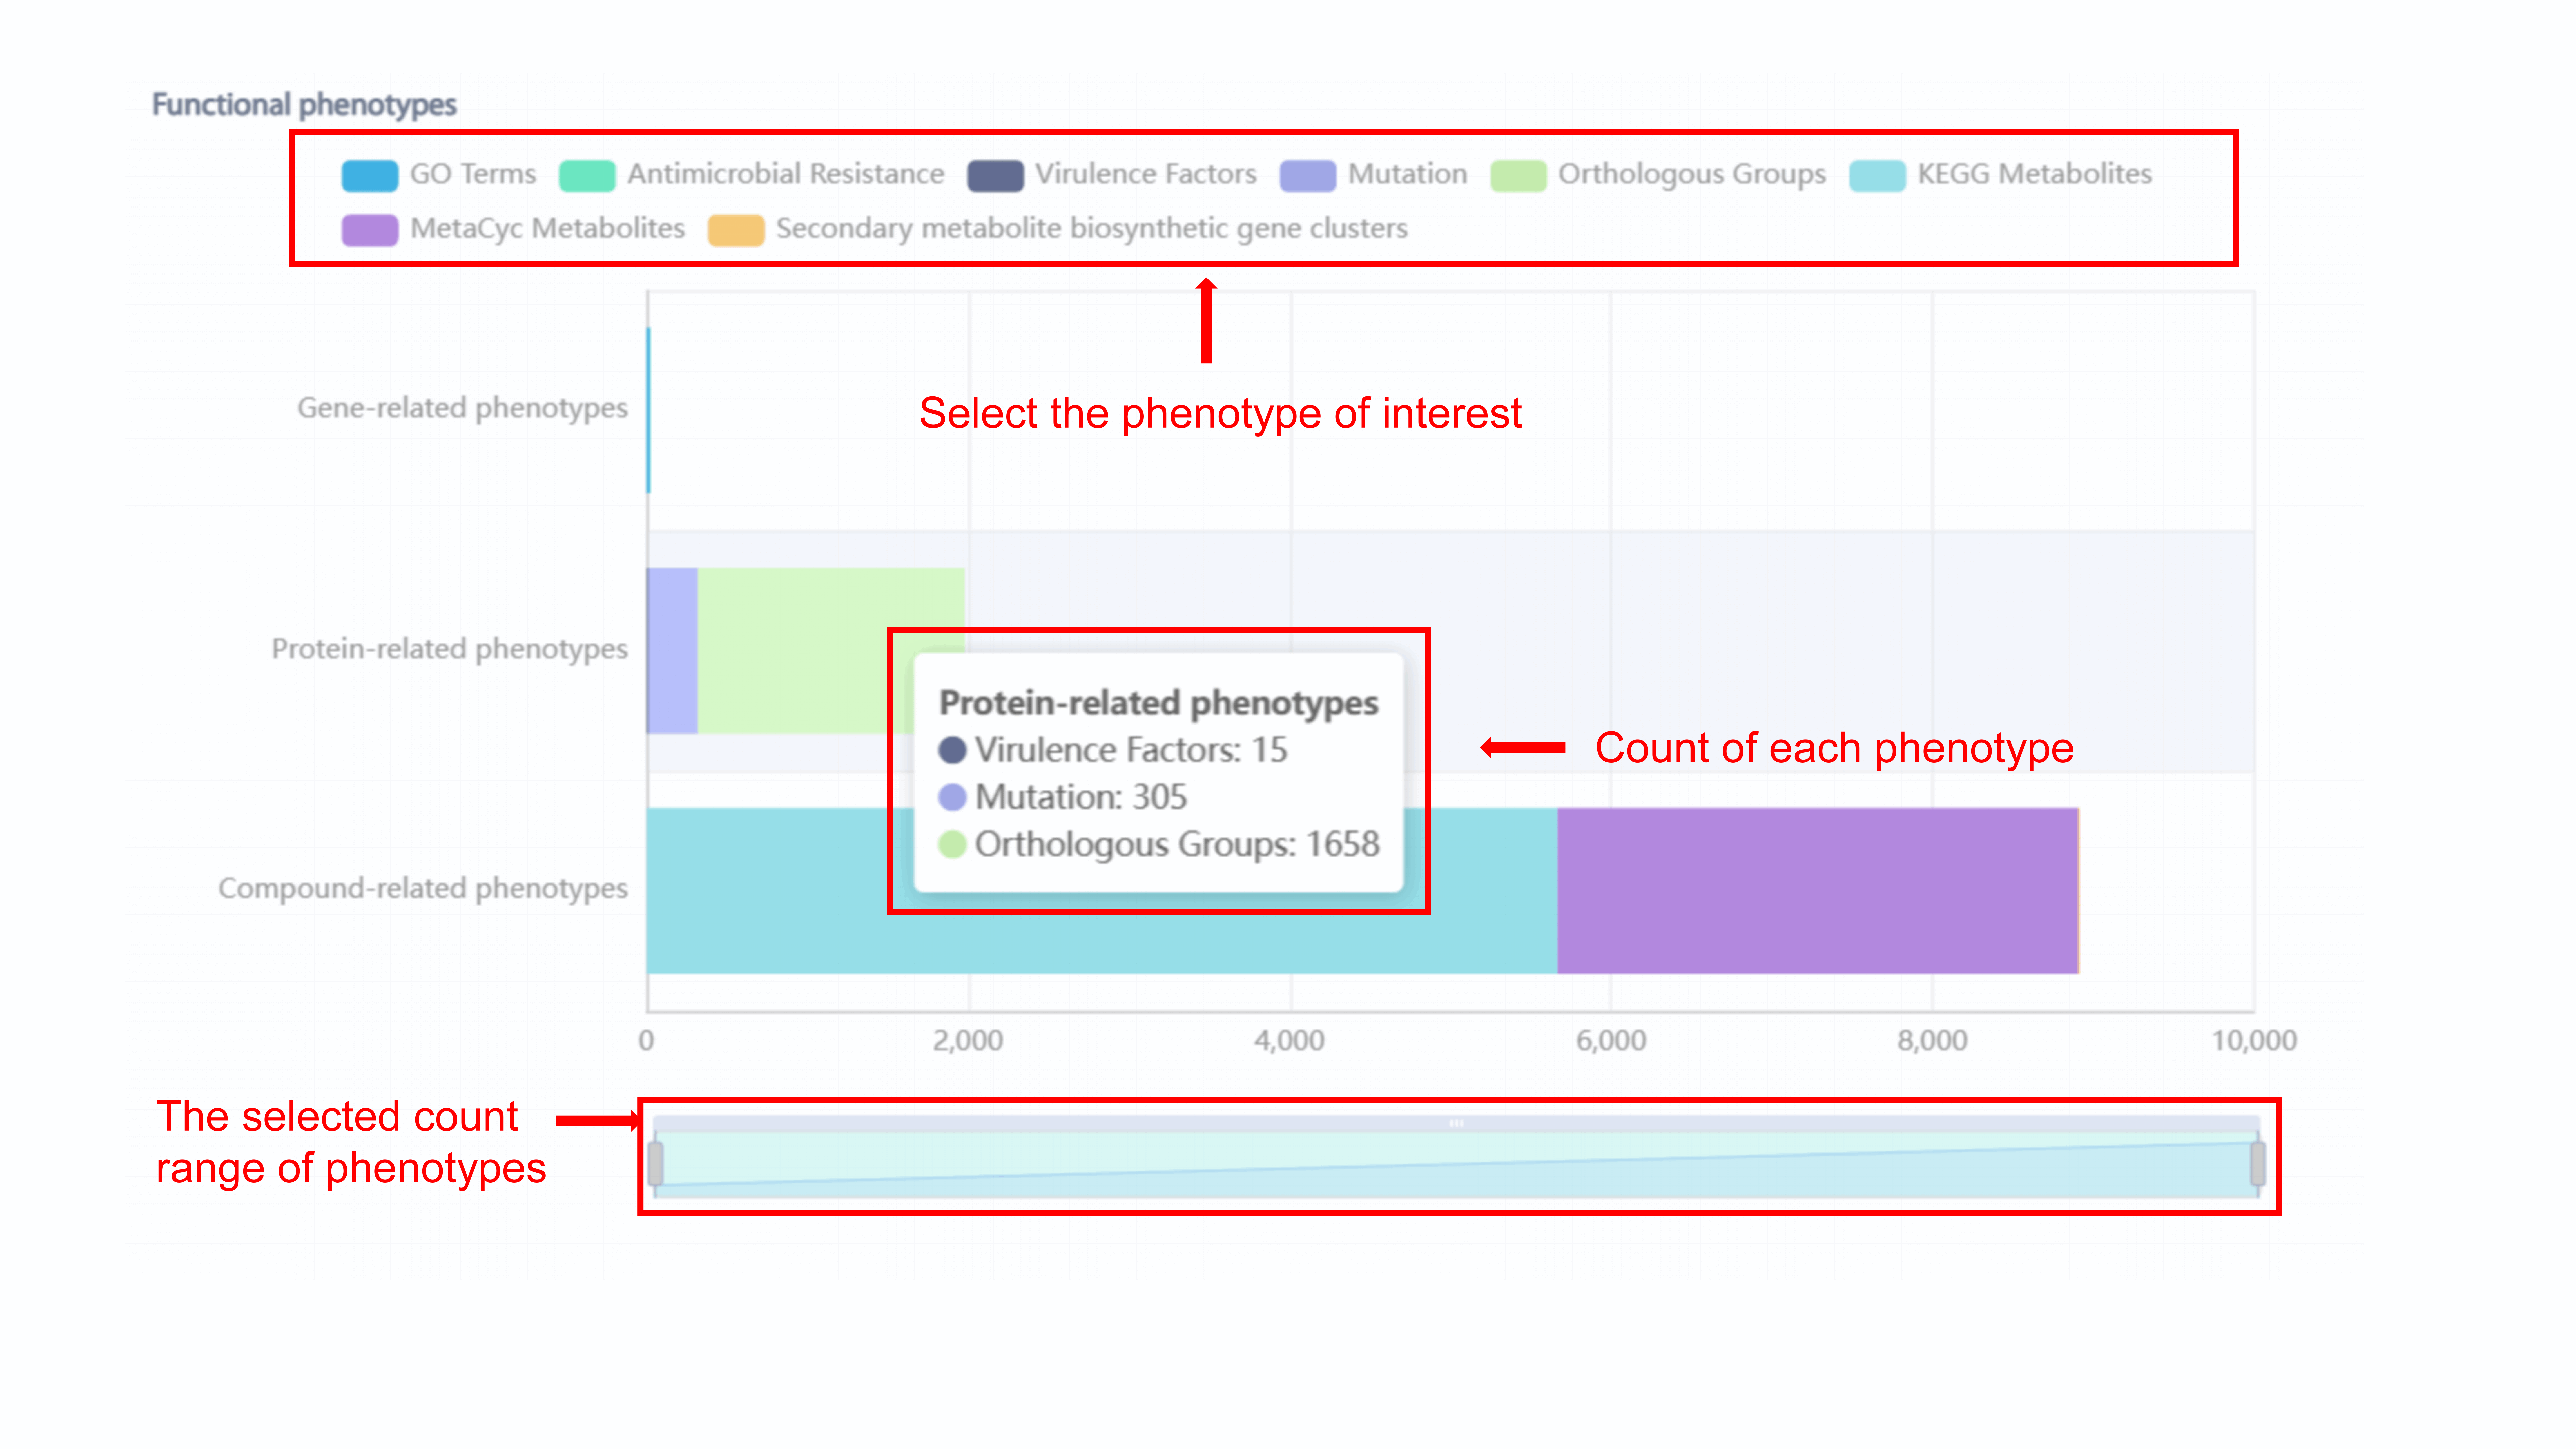
The same with polyphasic phenotypes, the count of
phenotypes will display if user put mouse above the bar. For the statistics of
functional phenotypes, user can select or unslect the phenotype by clicking each
phenotype in the legend. For example, we unselect GO Terms, the GO Tearms turn into
gray in the legend, and the count of GO Terms will not display in the bar chart. In
addition, user can choose the specific count range of phenotypes.
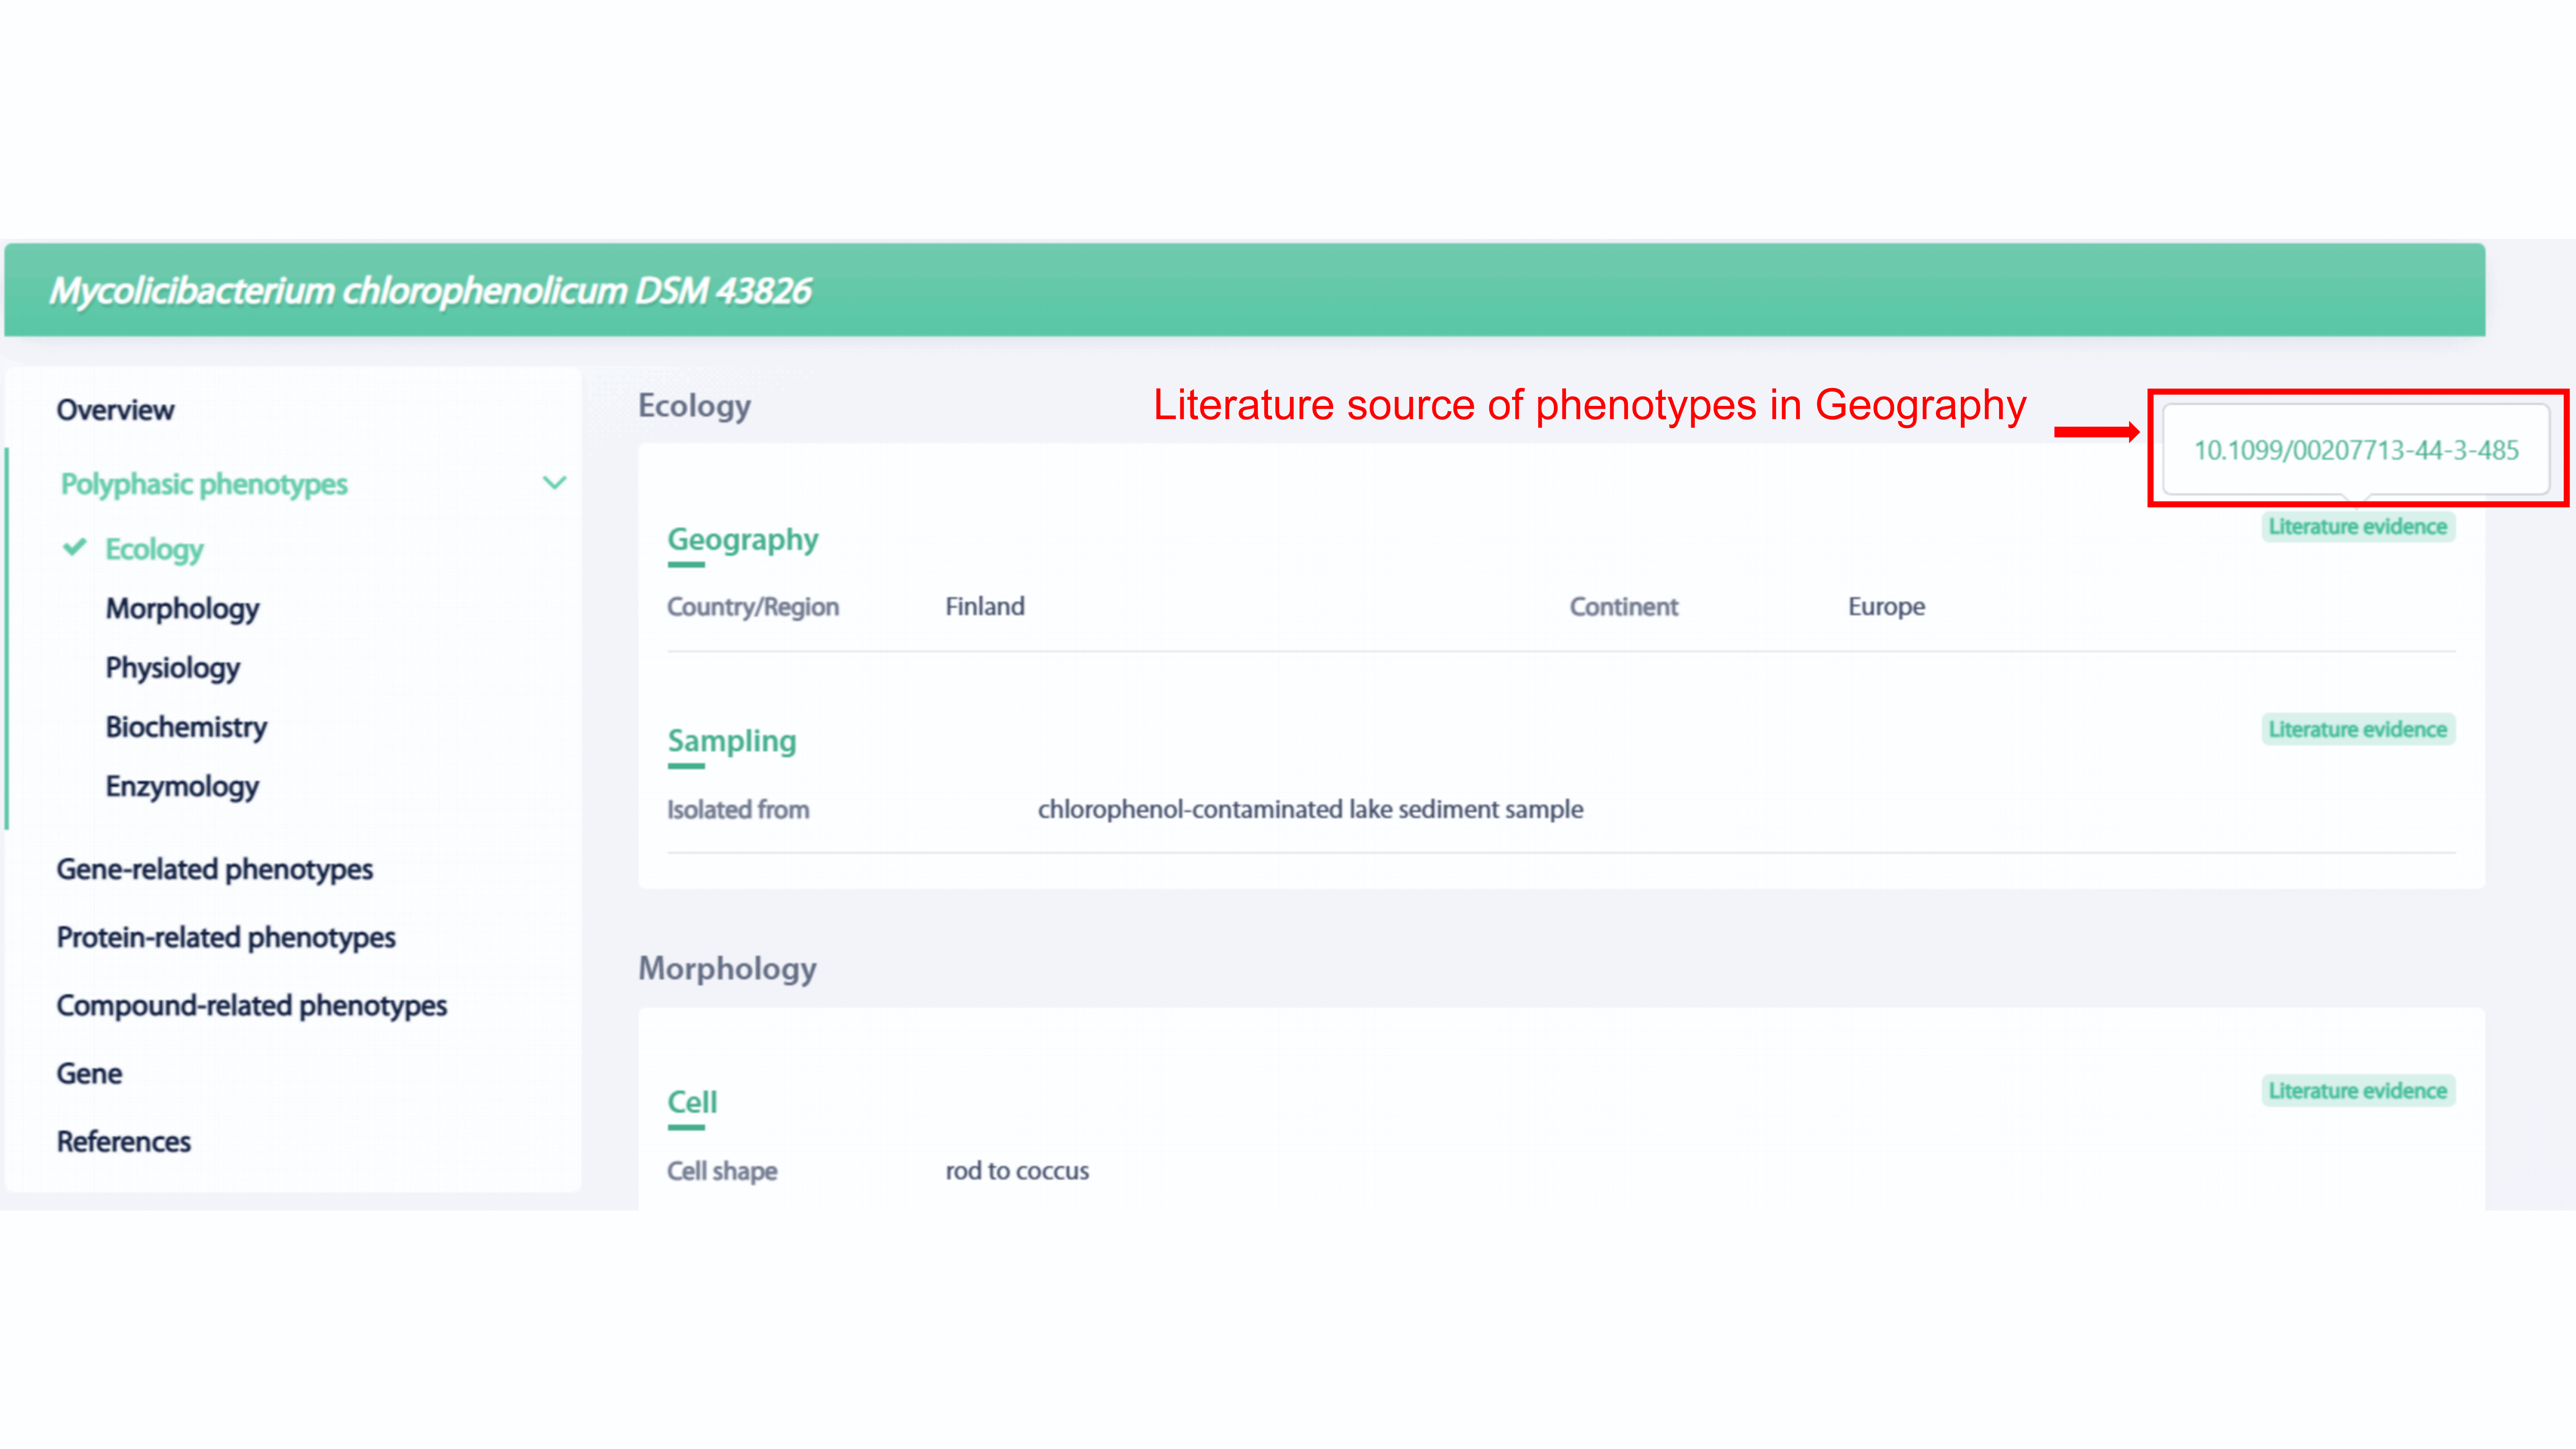
Phenotype categories, such as Ecology, Morphology,
Phenotype categories, such as Ecology, Morphology, Physiology, Biochemistry,
Enzymology, are included in the polyphasic phenotypes section of strain. The DOI of
the literature will provided if the phenotype is curated from literature and user
can go to the page of original literature by click the DOI.
Functional phenotypes includes gene-related phenotypes
section, protein-related phenotypes section, and compound-related phenotypes
section. Almost every key phenotype is hyperlinked for more detailed information,
and by clicking on it user will get the desired information quickly.
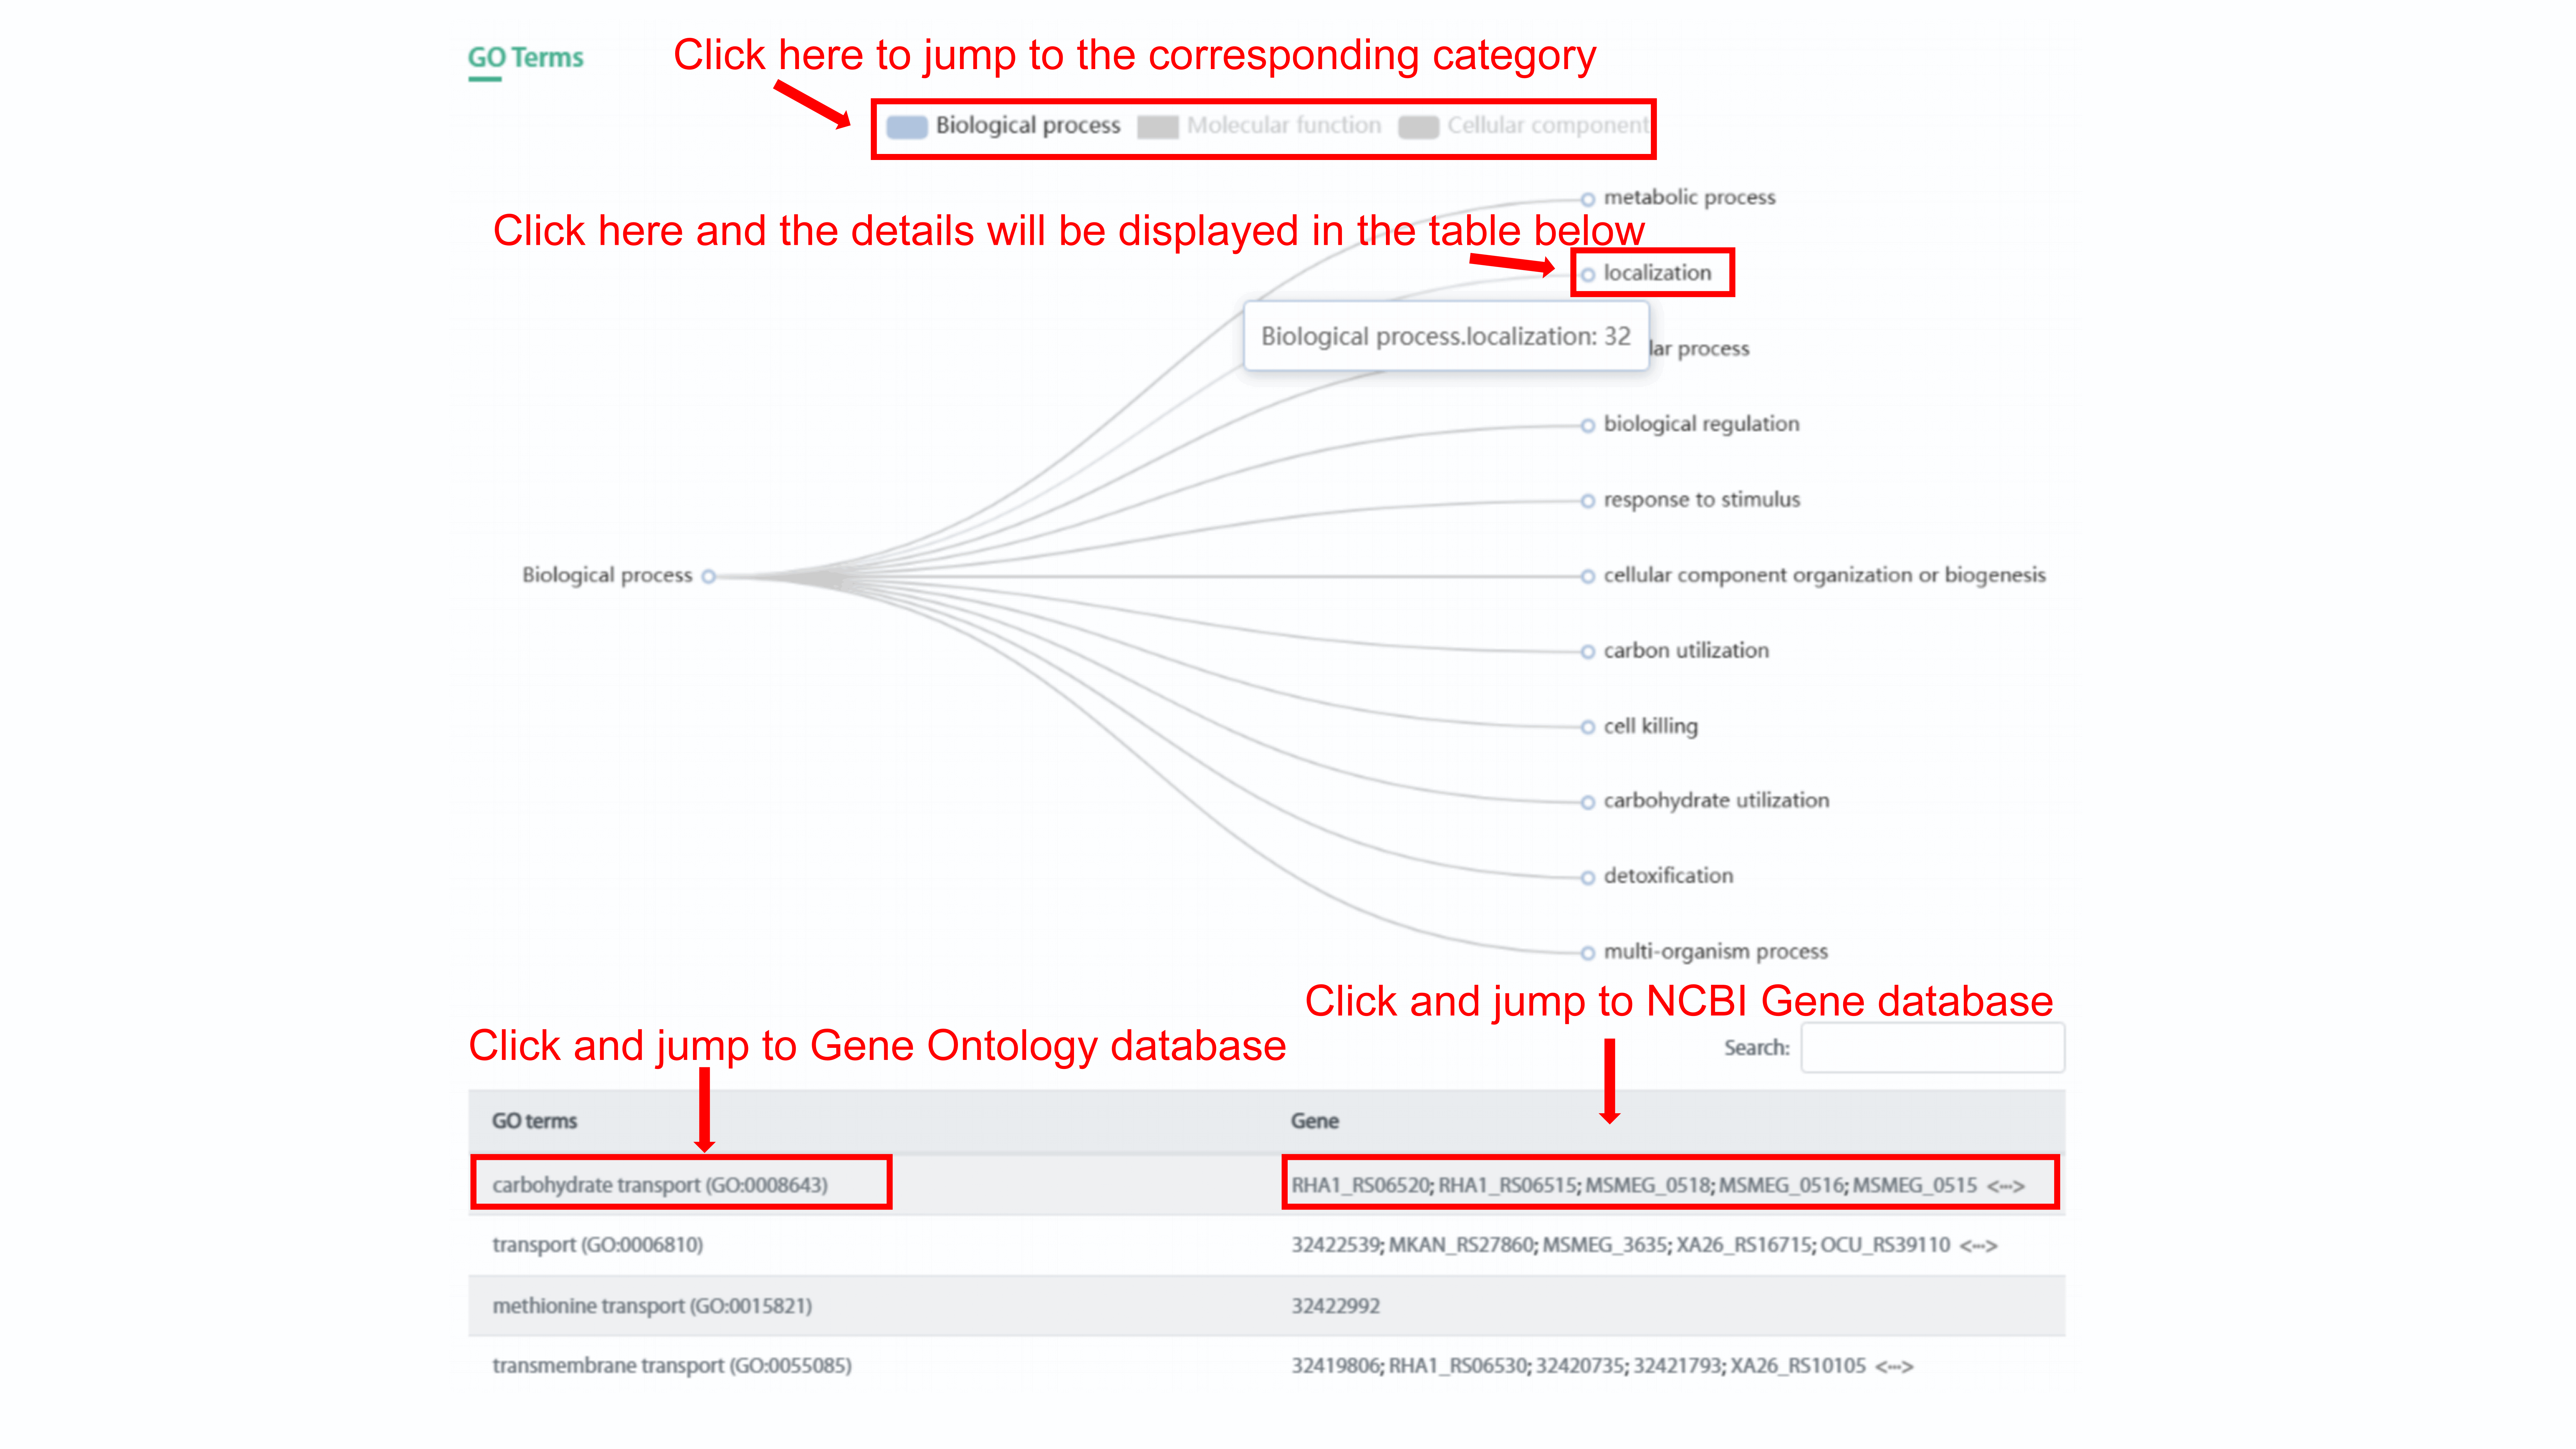
Gene-related phenotypes section includes Gene ontology
(GO) annotations and Antimicrobial resistance (AMR). User can go to the specific
category of three category of GO term by click the legend. For example, we choose
biological process, and 11 subcategories of biological process will display by tree
chart. The number of GO term in each subcategory will be show if user click the name
of the subcategory and the list of GO terms that belongs to this subcategory will be
shown in the table below. User can go to related GO term in Gene Ontology database
and related gene in NCBI Gene database by clicking the name of GO term and gene
symbol, respectively.
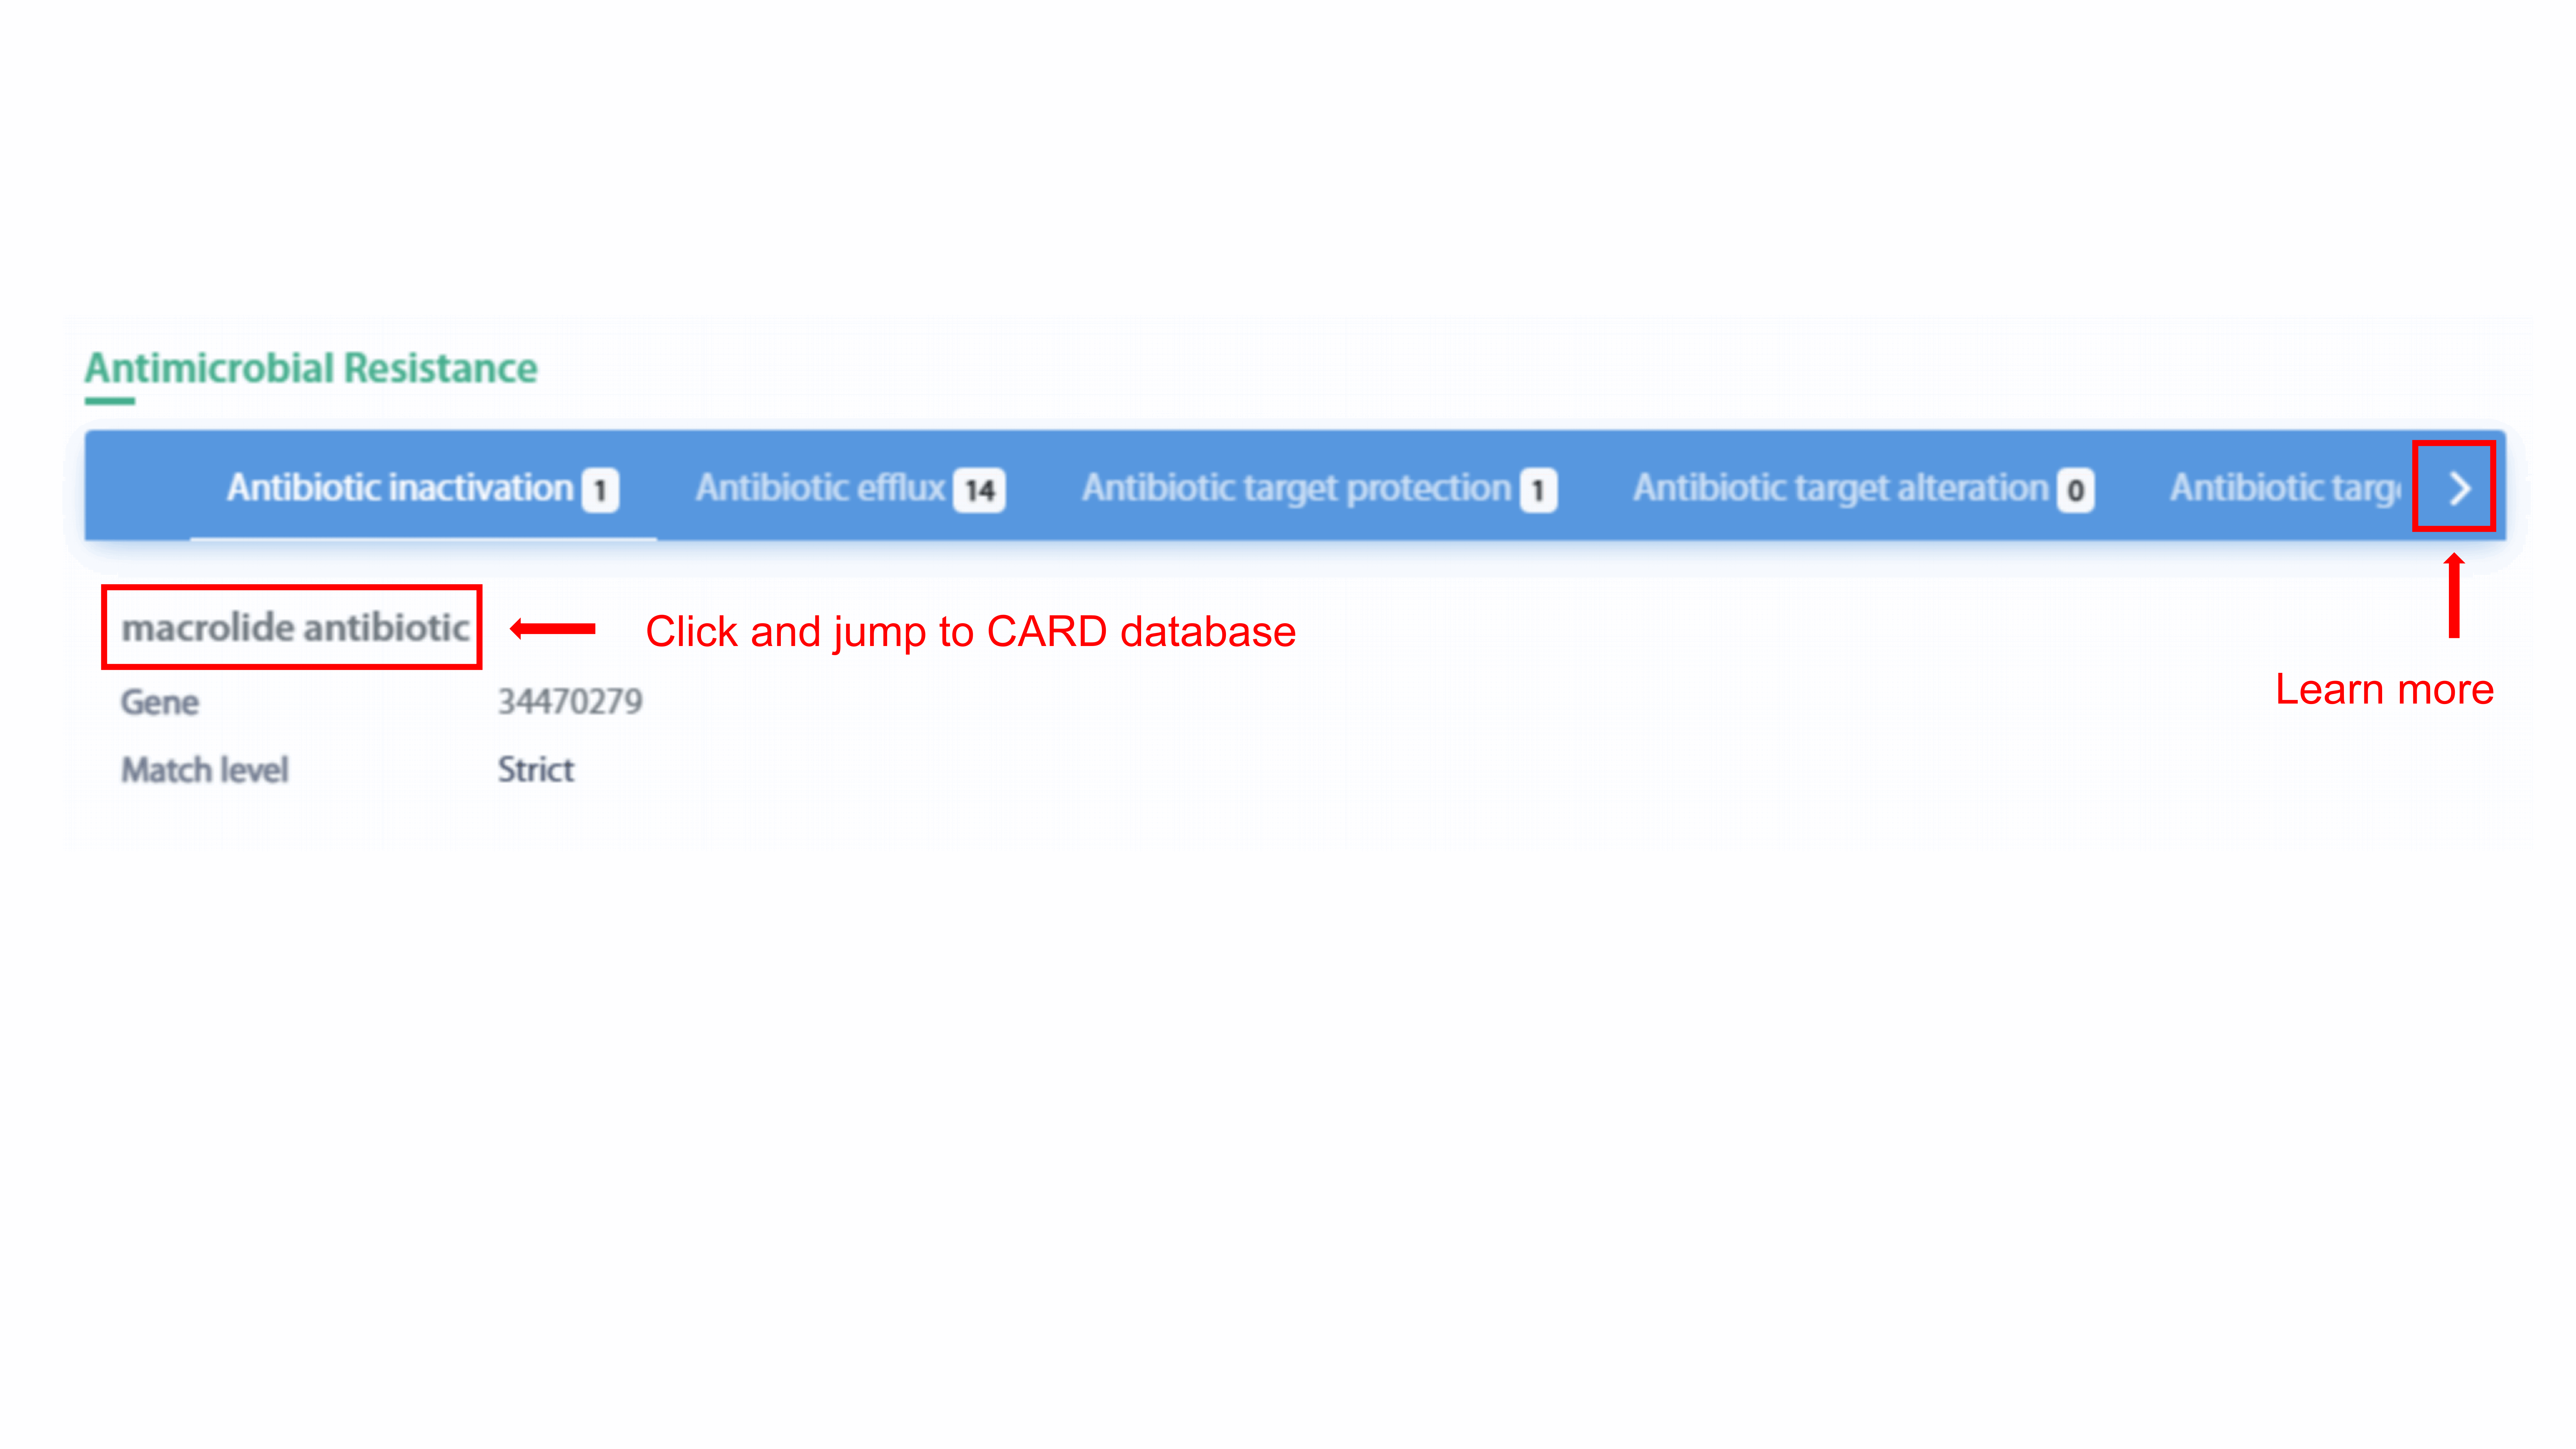
The tab chart displays all AMR mechanism of the
strain. User can view the drug class, resistant gene, and match level by clicking
each tab. User can go to the drug class page in CARD database and gene page in NCBI
Gene database by clicking drug class name and gene symbol, respectively.
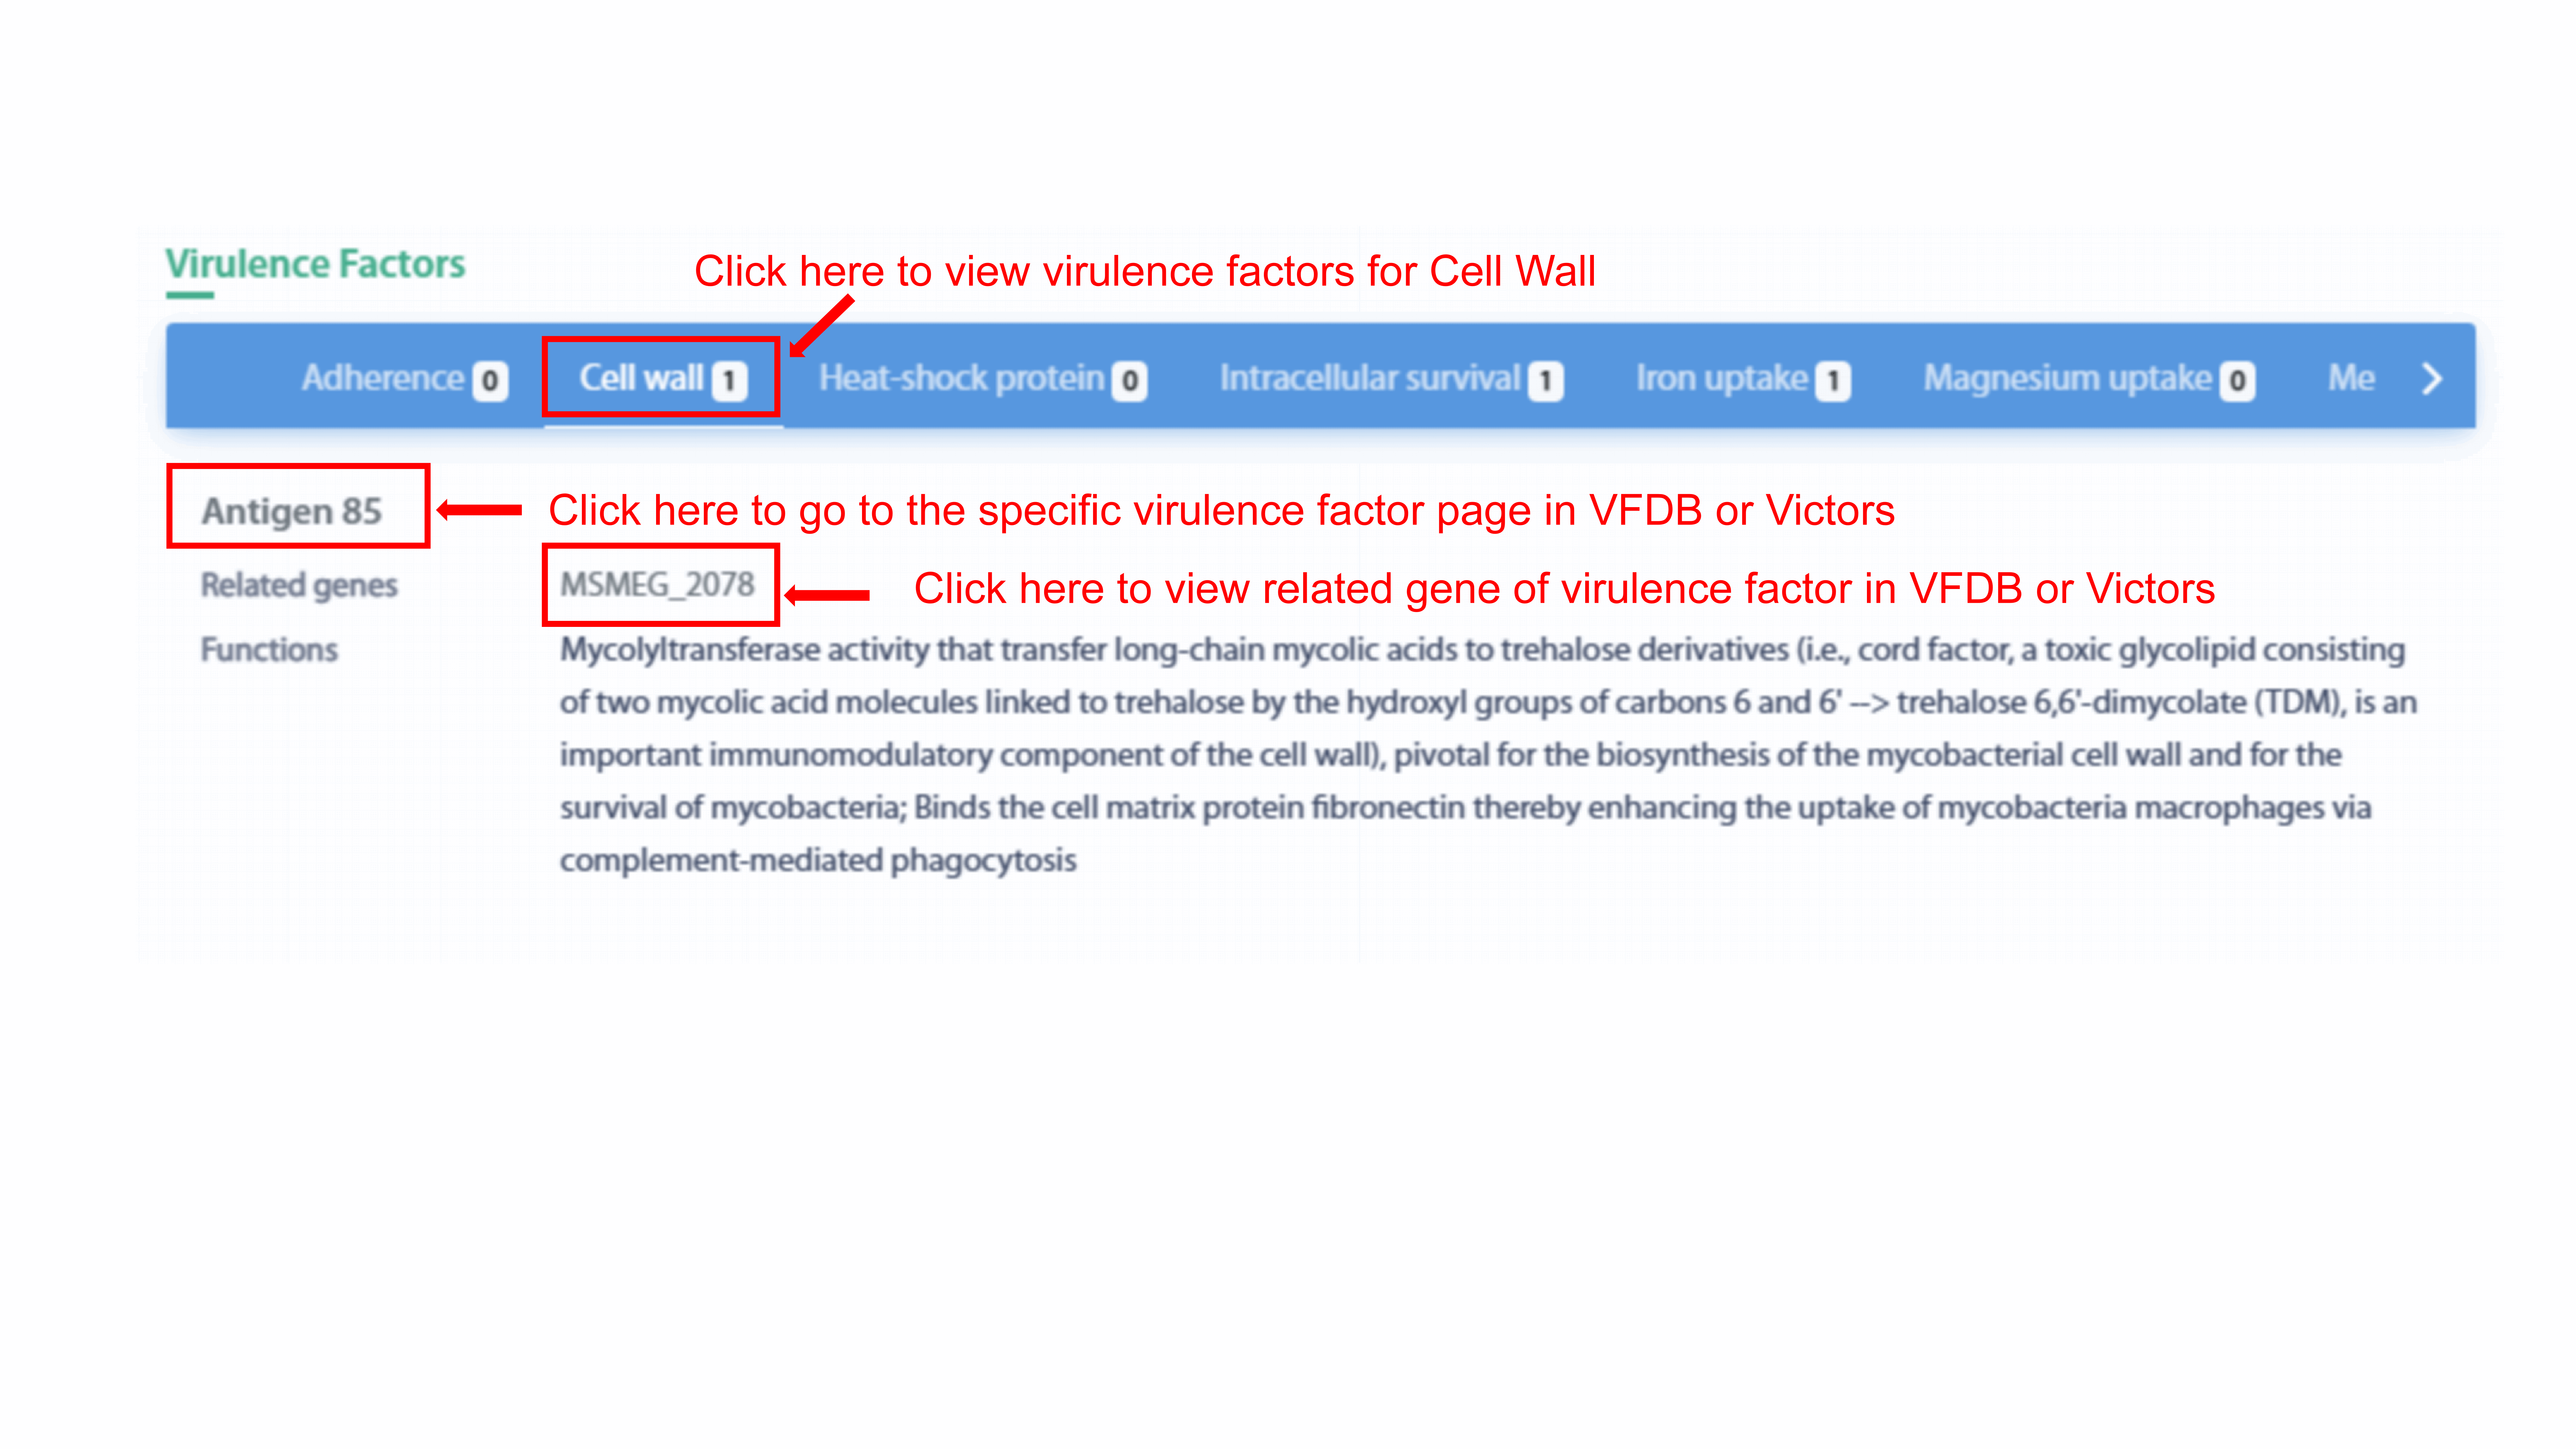
Protein-related phenotypes section contains virulence
factors, amino acid mutations, and orthologous groups. The tab chart displays all
virulence factor class of the strain. User can view the virulence factor name,
related genes, related functions and characteristics of all virulence factors in
this class by clicking each tab. User can go to the virulence factor page in VFDB
database or Victor database by clicking virulence factor name. Alternatively, for
those virulence factors that have not been curated, user can go to related
literatures in PubMed. In addition, user can go to the virulence factor page in VFDB
database or Victor database by clicking related gene of virulence factor.
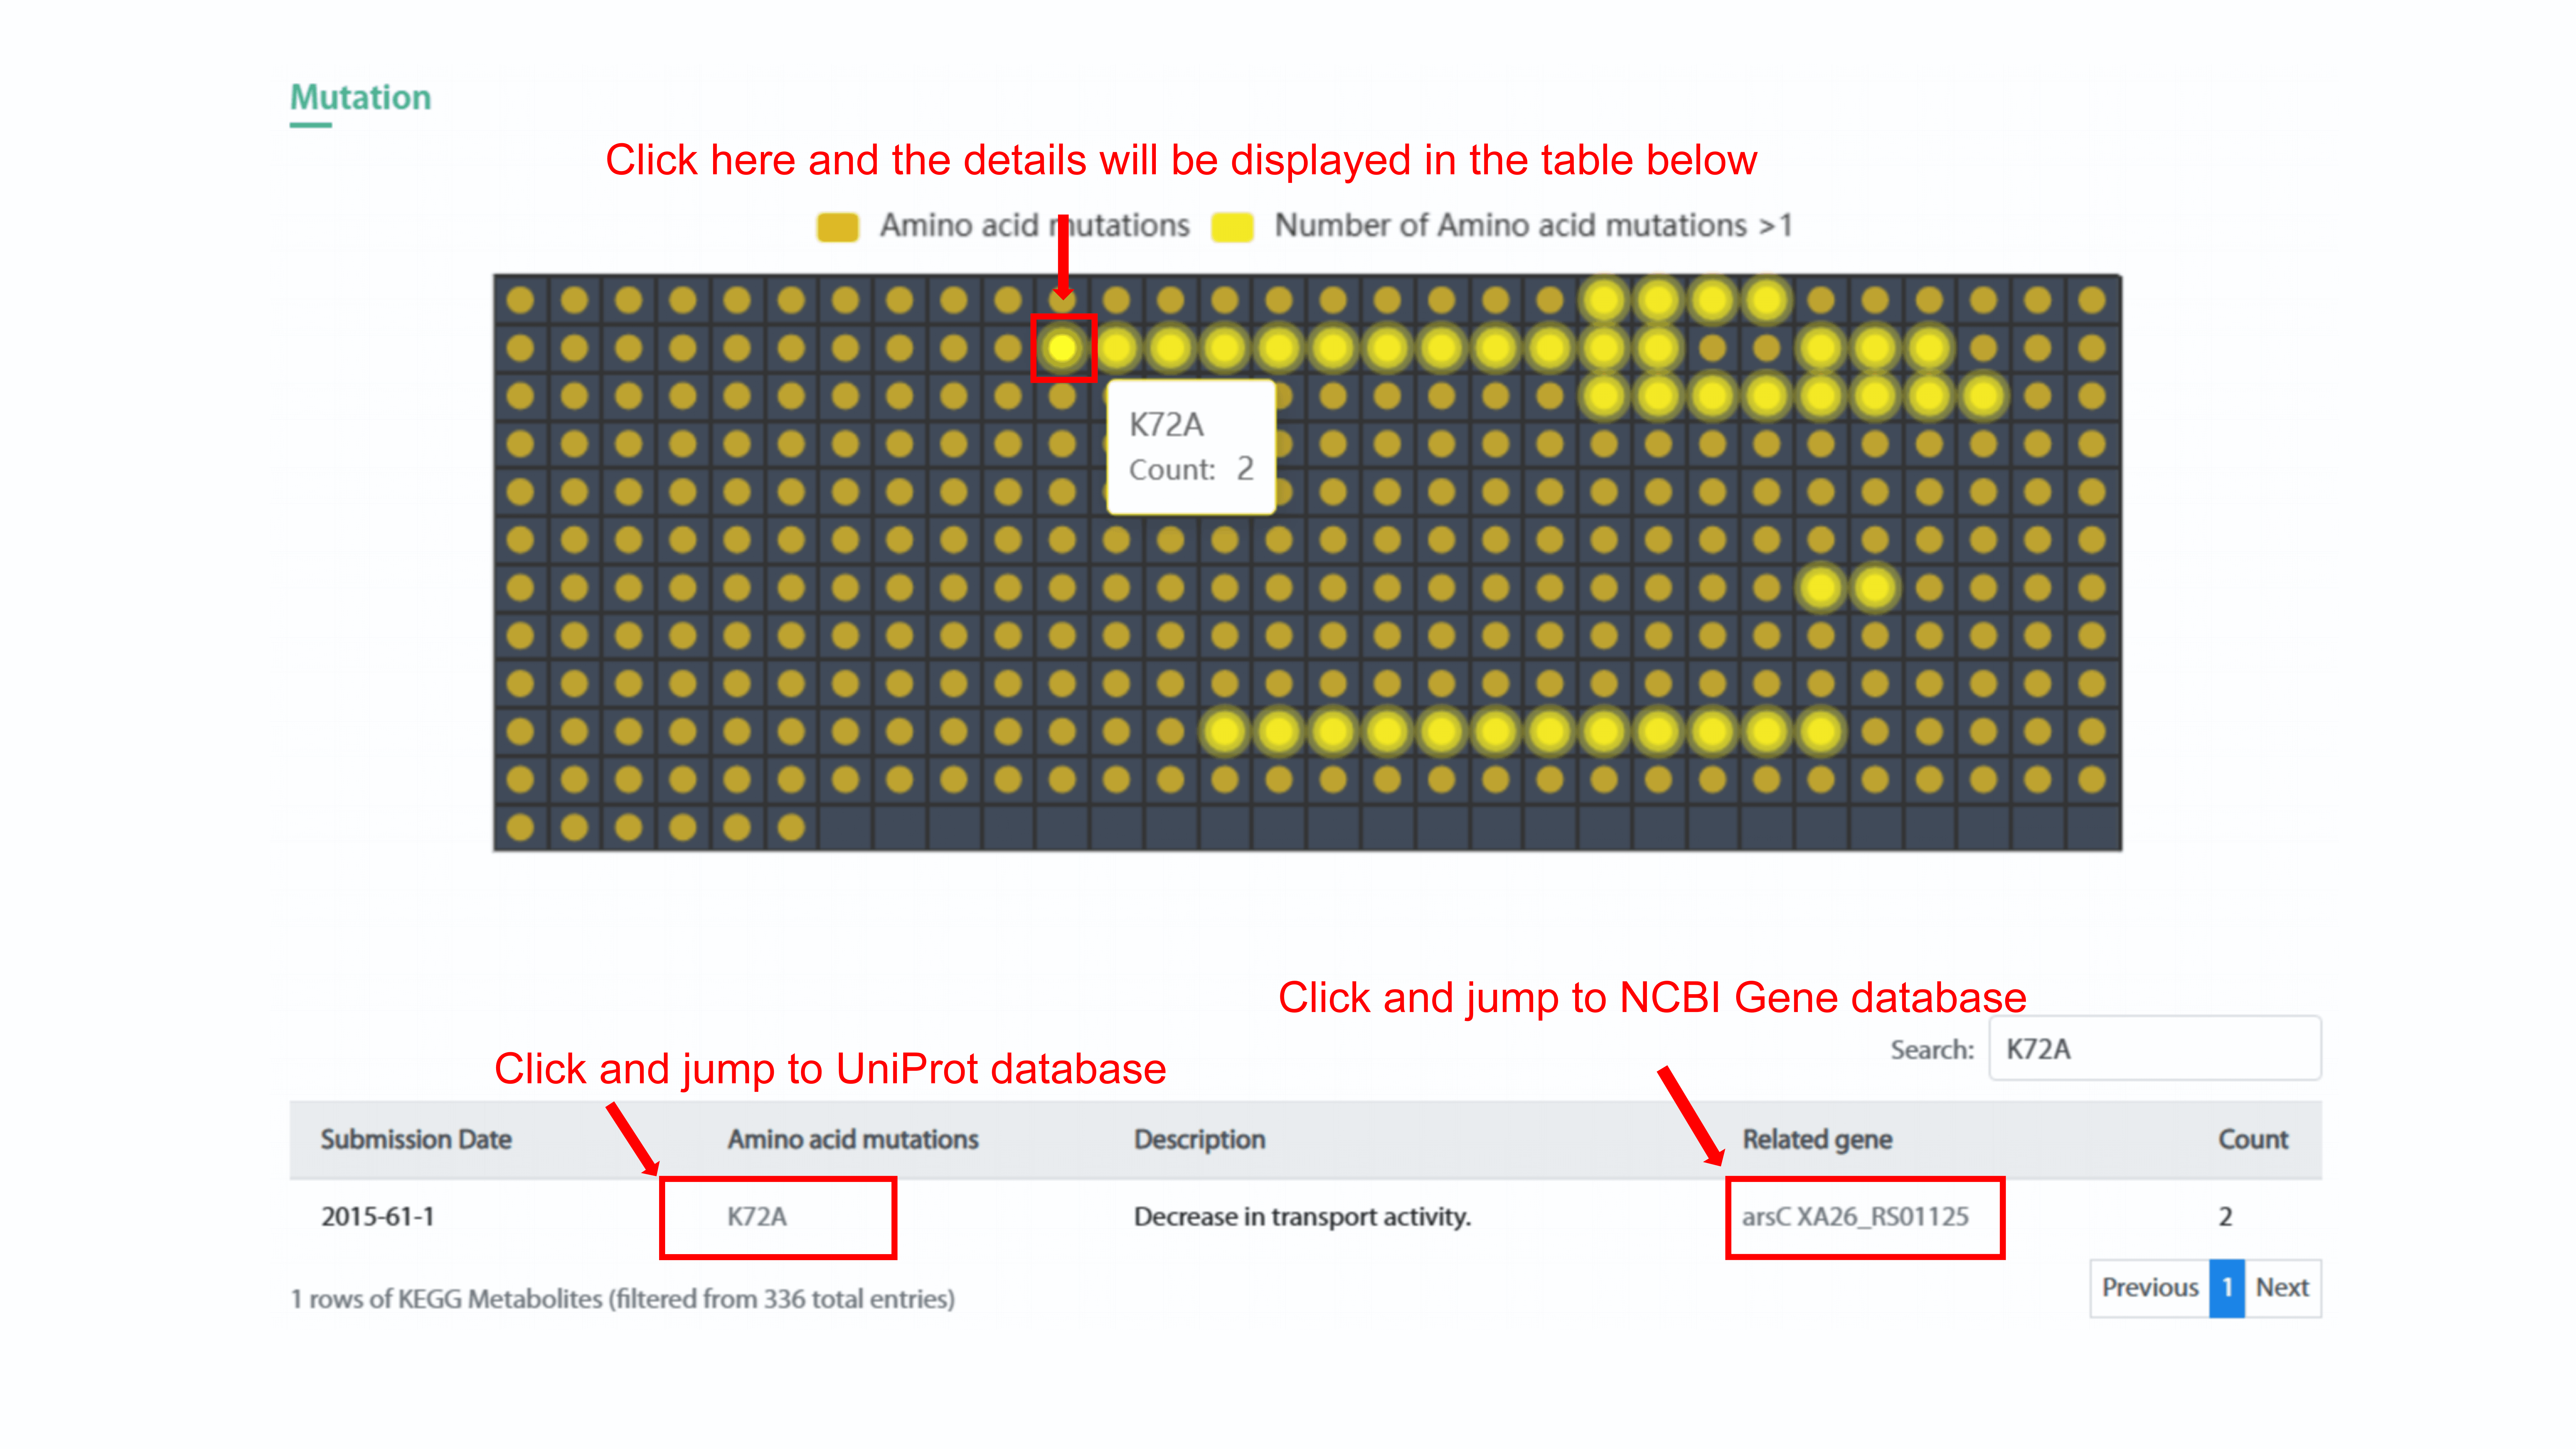
The heatmap chart displays the amino acid mutation and
count of this mutation in the strain. User can show specific count of mutation in
the strain by clicking the legend of Amino acid mutations or Number of Amino acid
mutations>1. By clicking each spot in the heatmap, user can see the type of amino
acid mutation and related count in the strain. In addition, the detail information
of this mutation will display in the table below. User can go to the protein page in
Uniprot database and gene page in NCBI Gene database by clicking mutation name and
gene symbol, respectively.
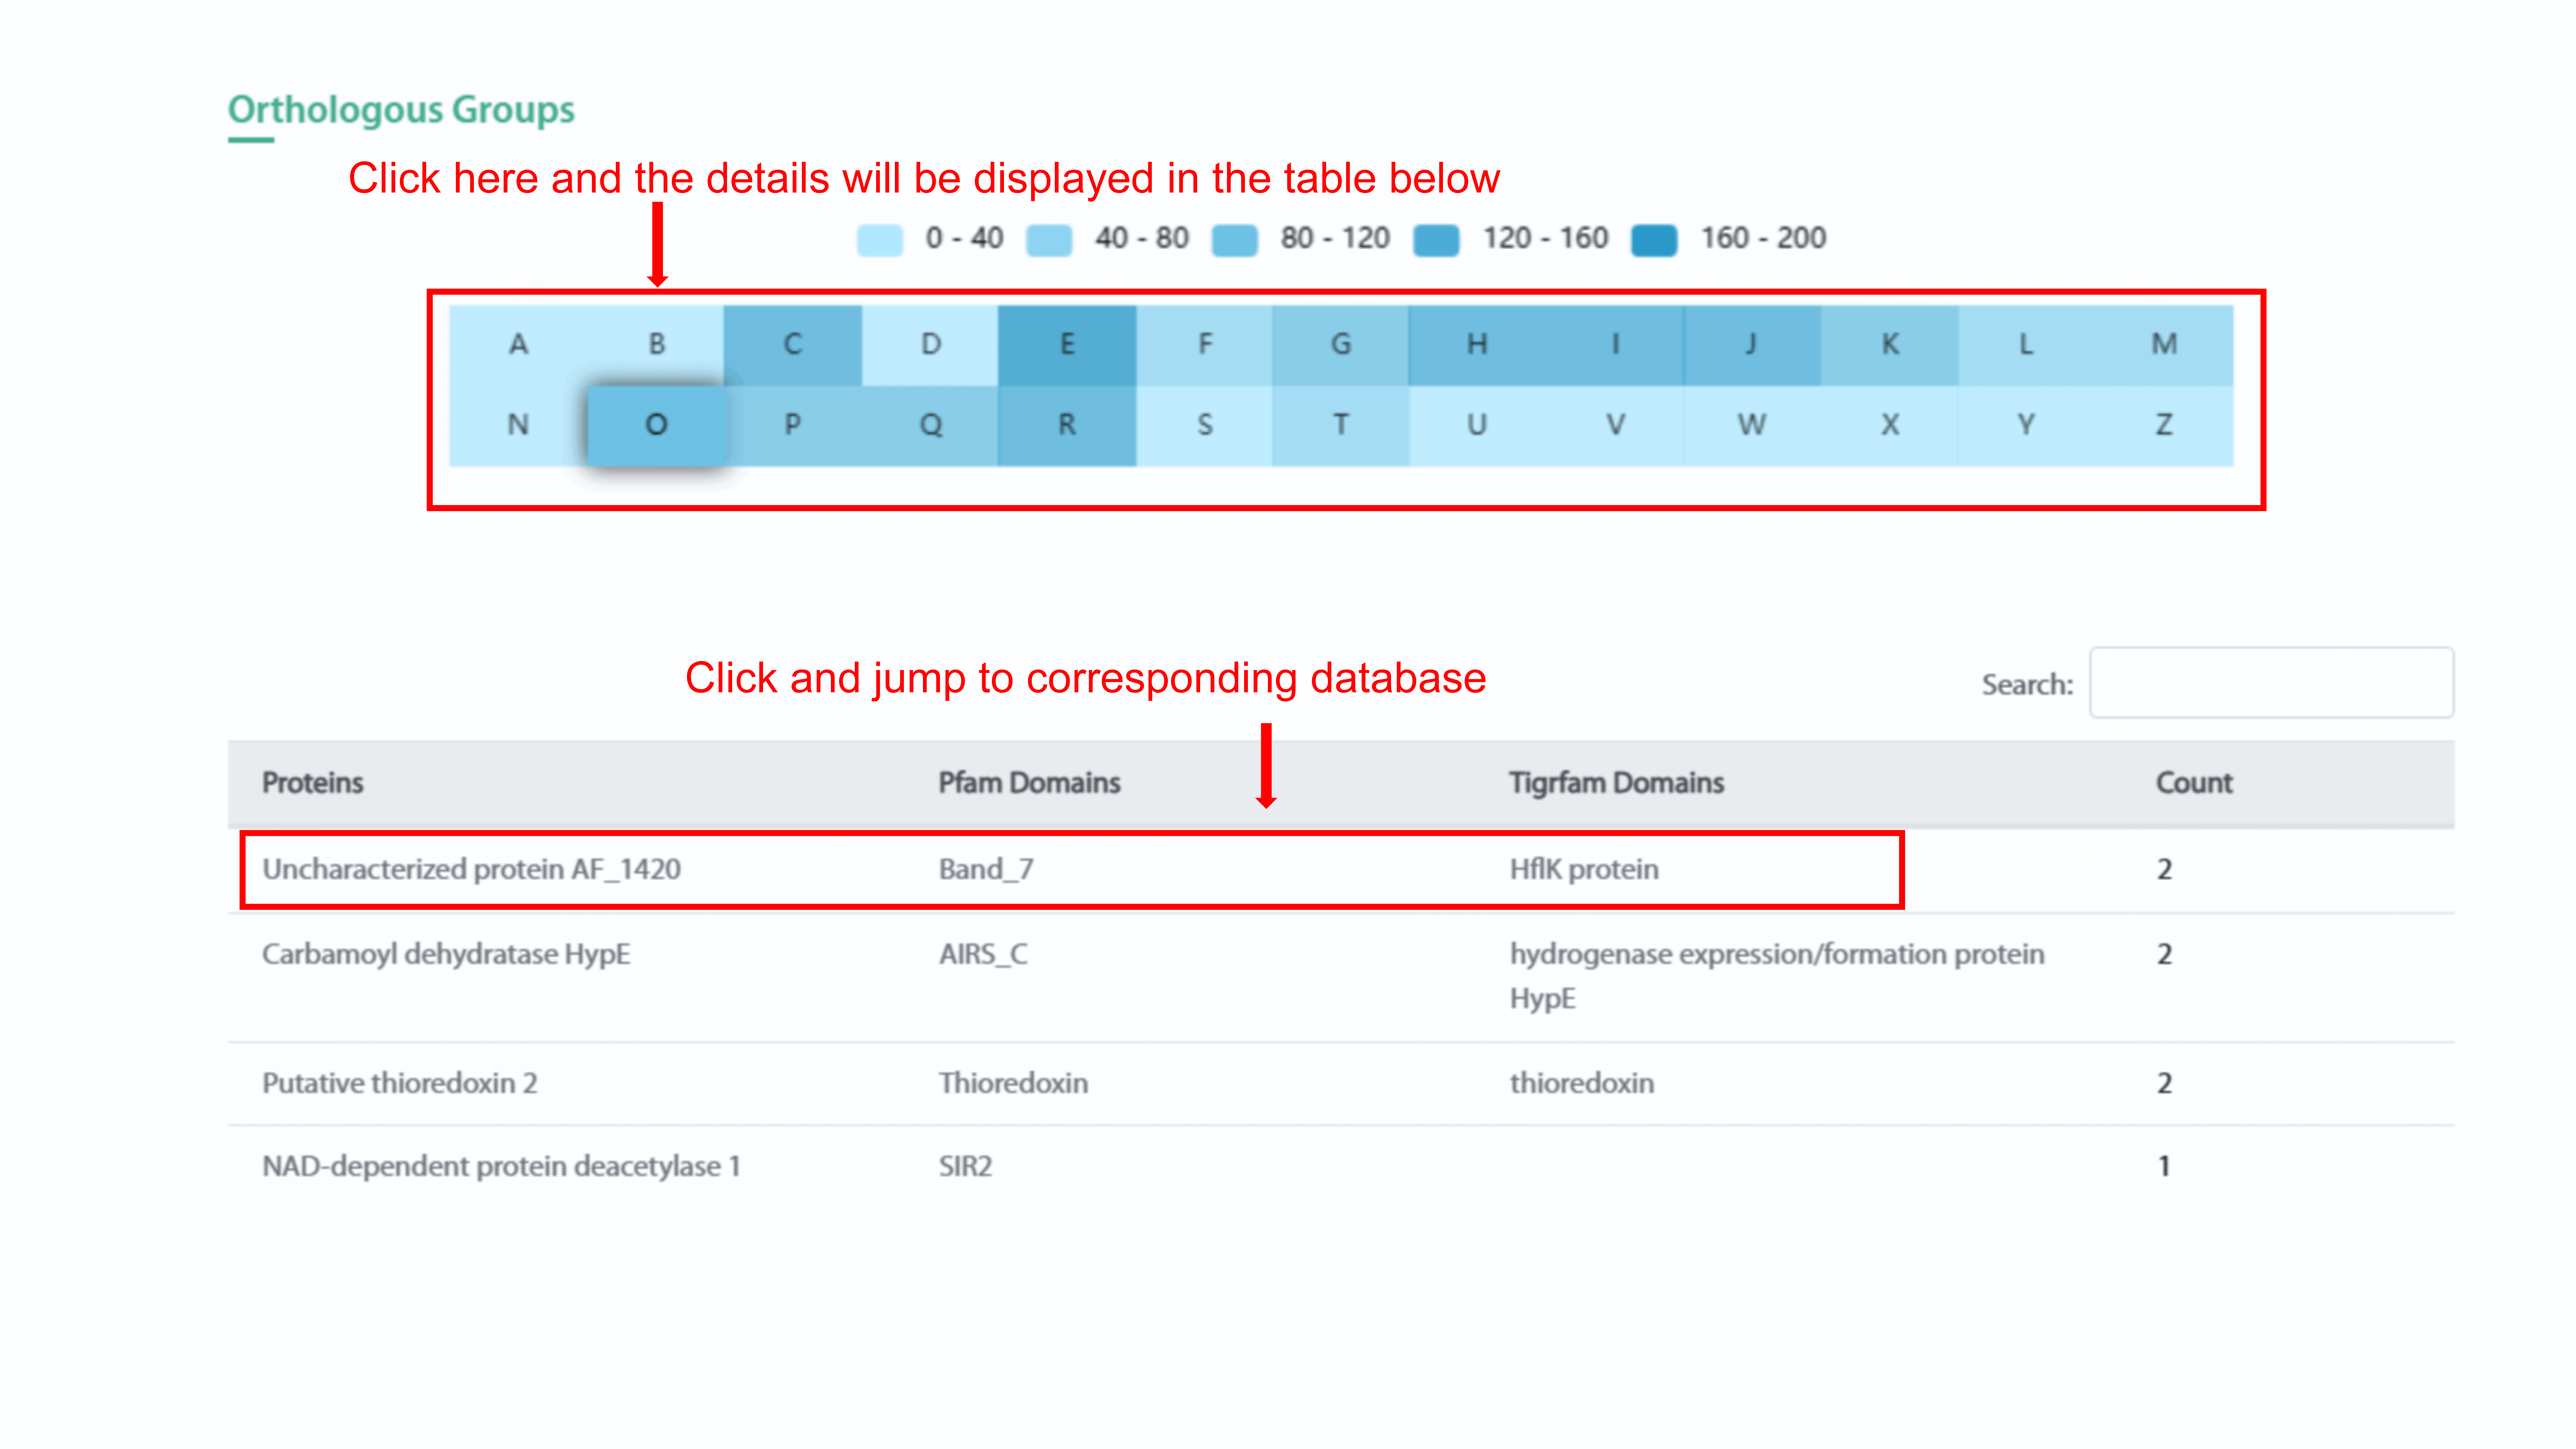
The heatmap chart displays the classes of orthologous
groups and protein count of this group in the strain. User can show specific protein
count range of orthologous group in the strain by clicking the legend. By clicking
each spot in the heatmap, user can see the type of orthologous group and related
protein count in the strain. In addition, the detail information of this orthologous
group will display in the table below. User can go to the related page in Uniprot
database, Pfam database, and Tigrfam database by clicking protein name, Pfam domain
name, and Tigrfam domain name, respectively.
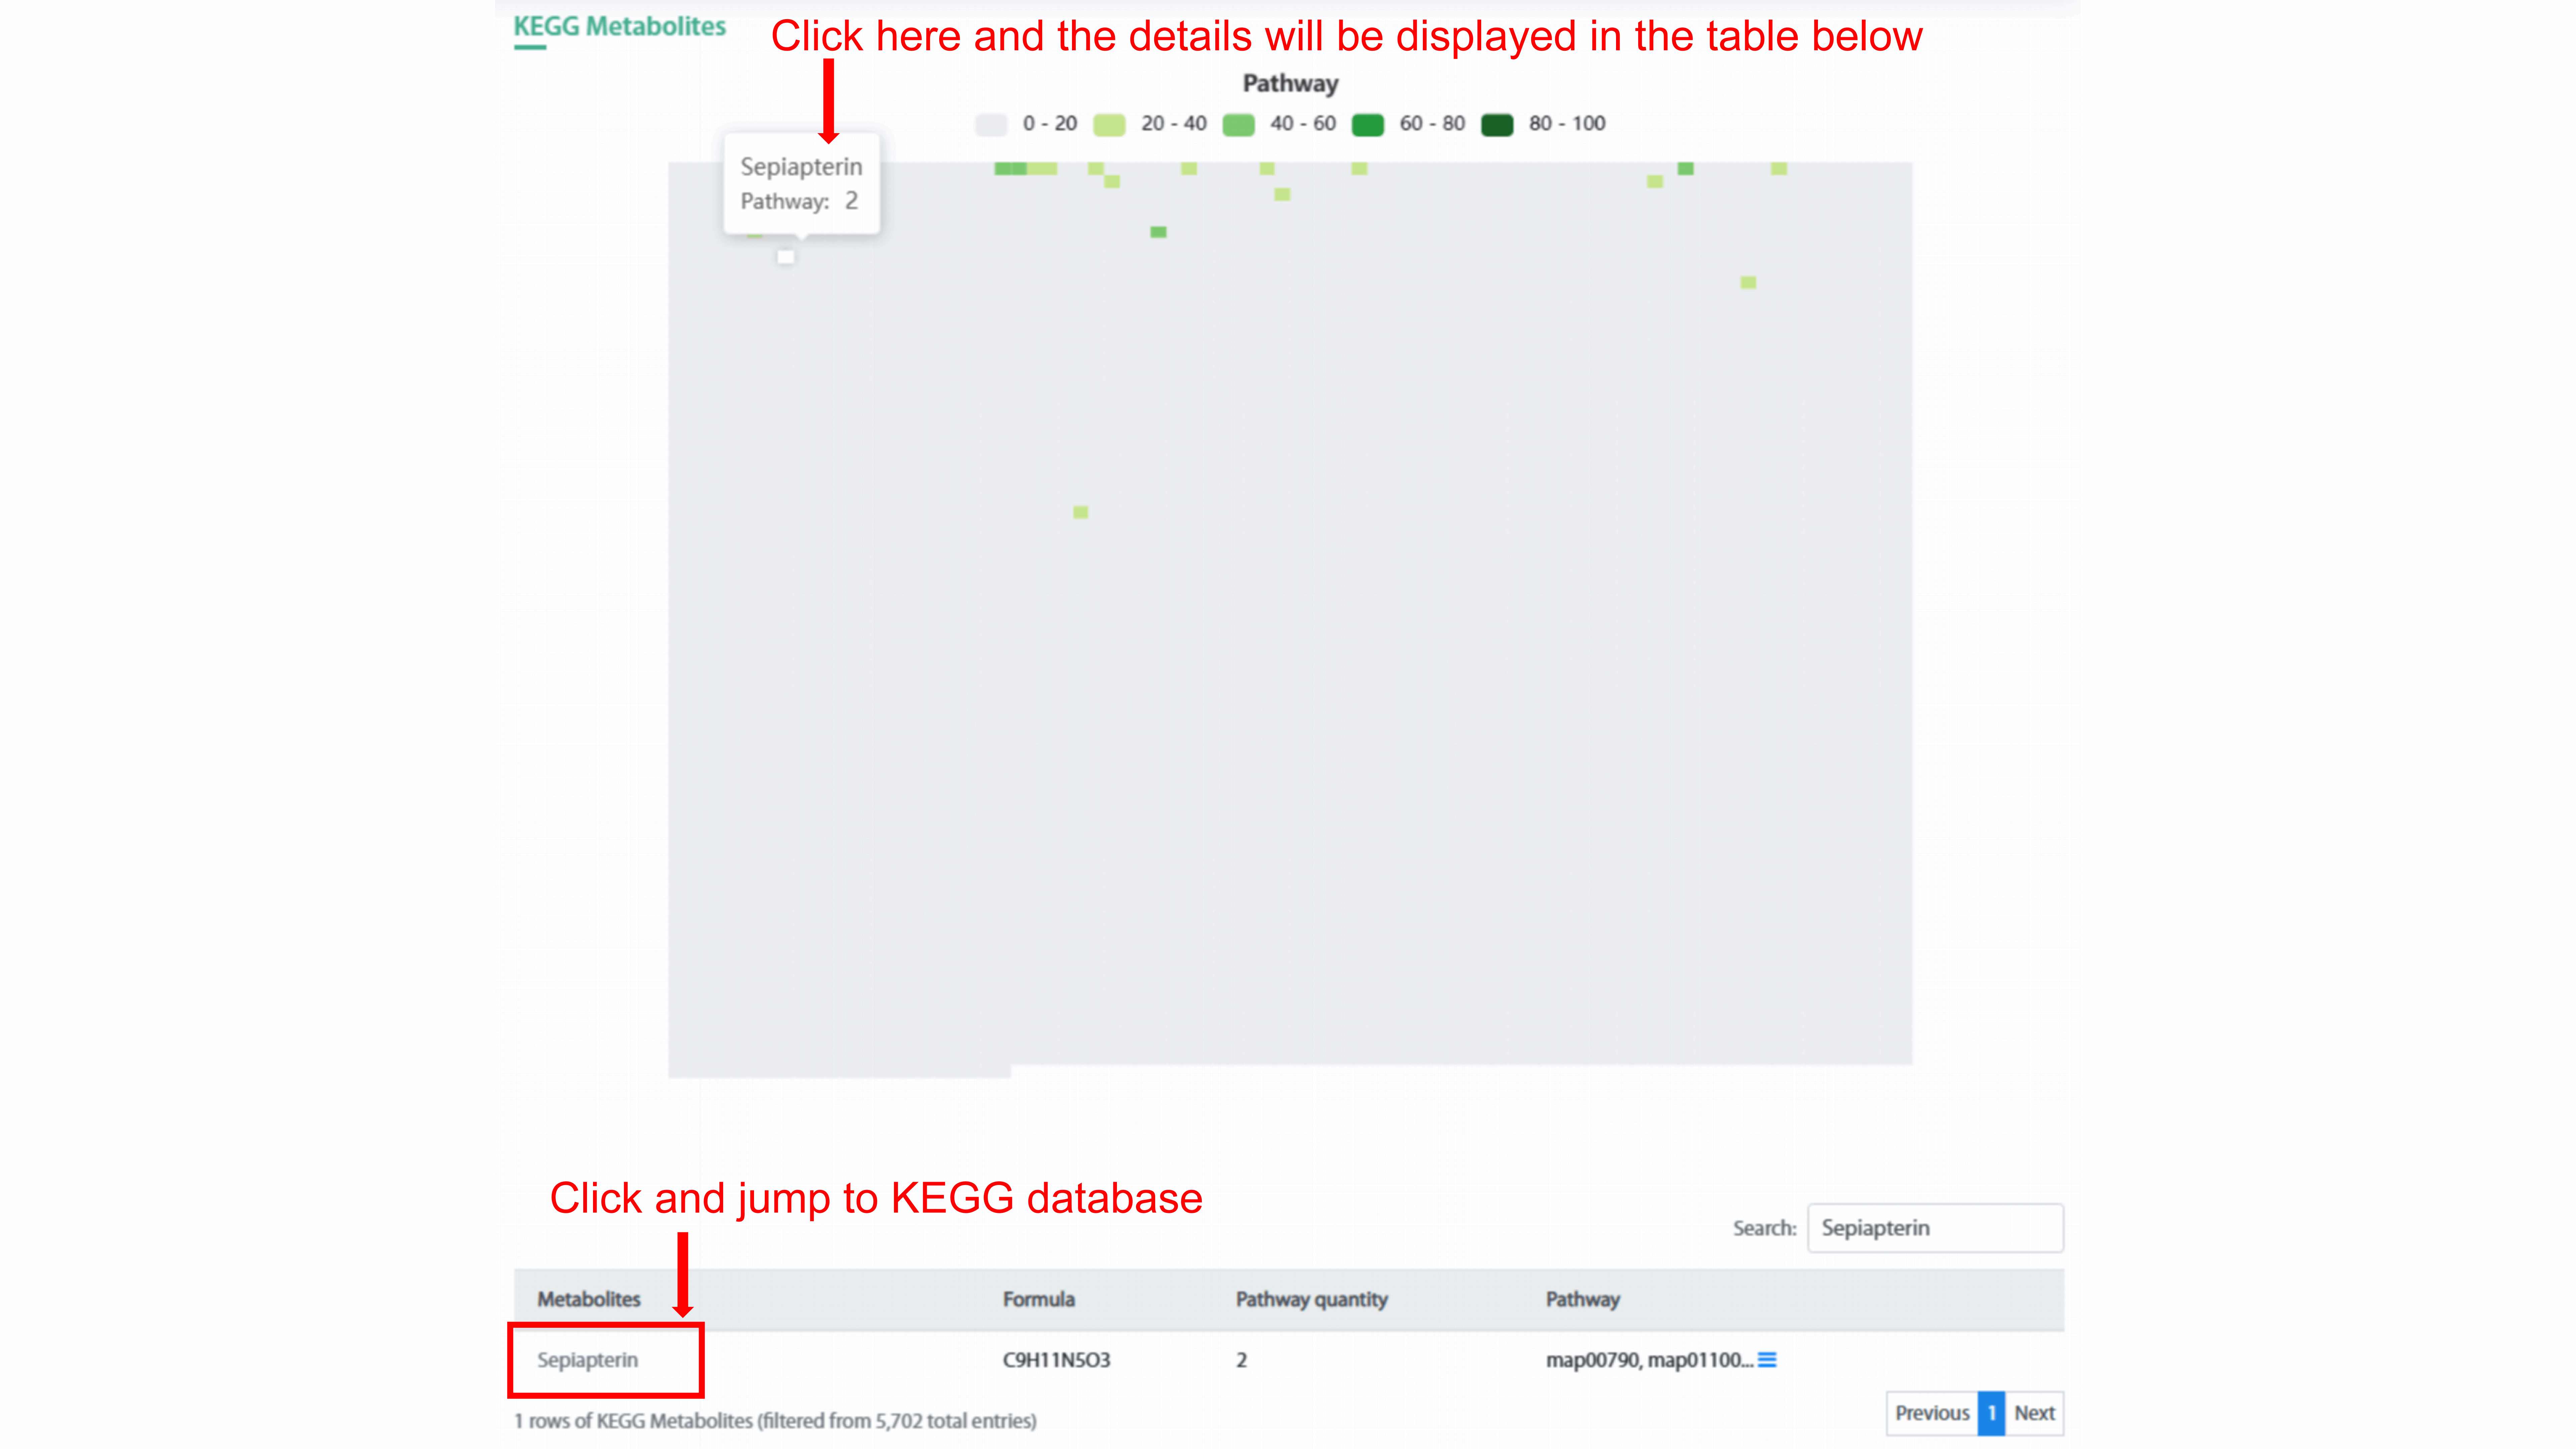
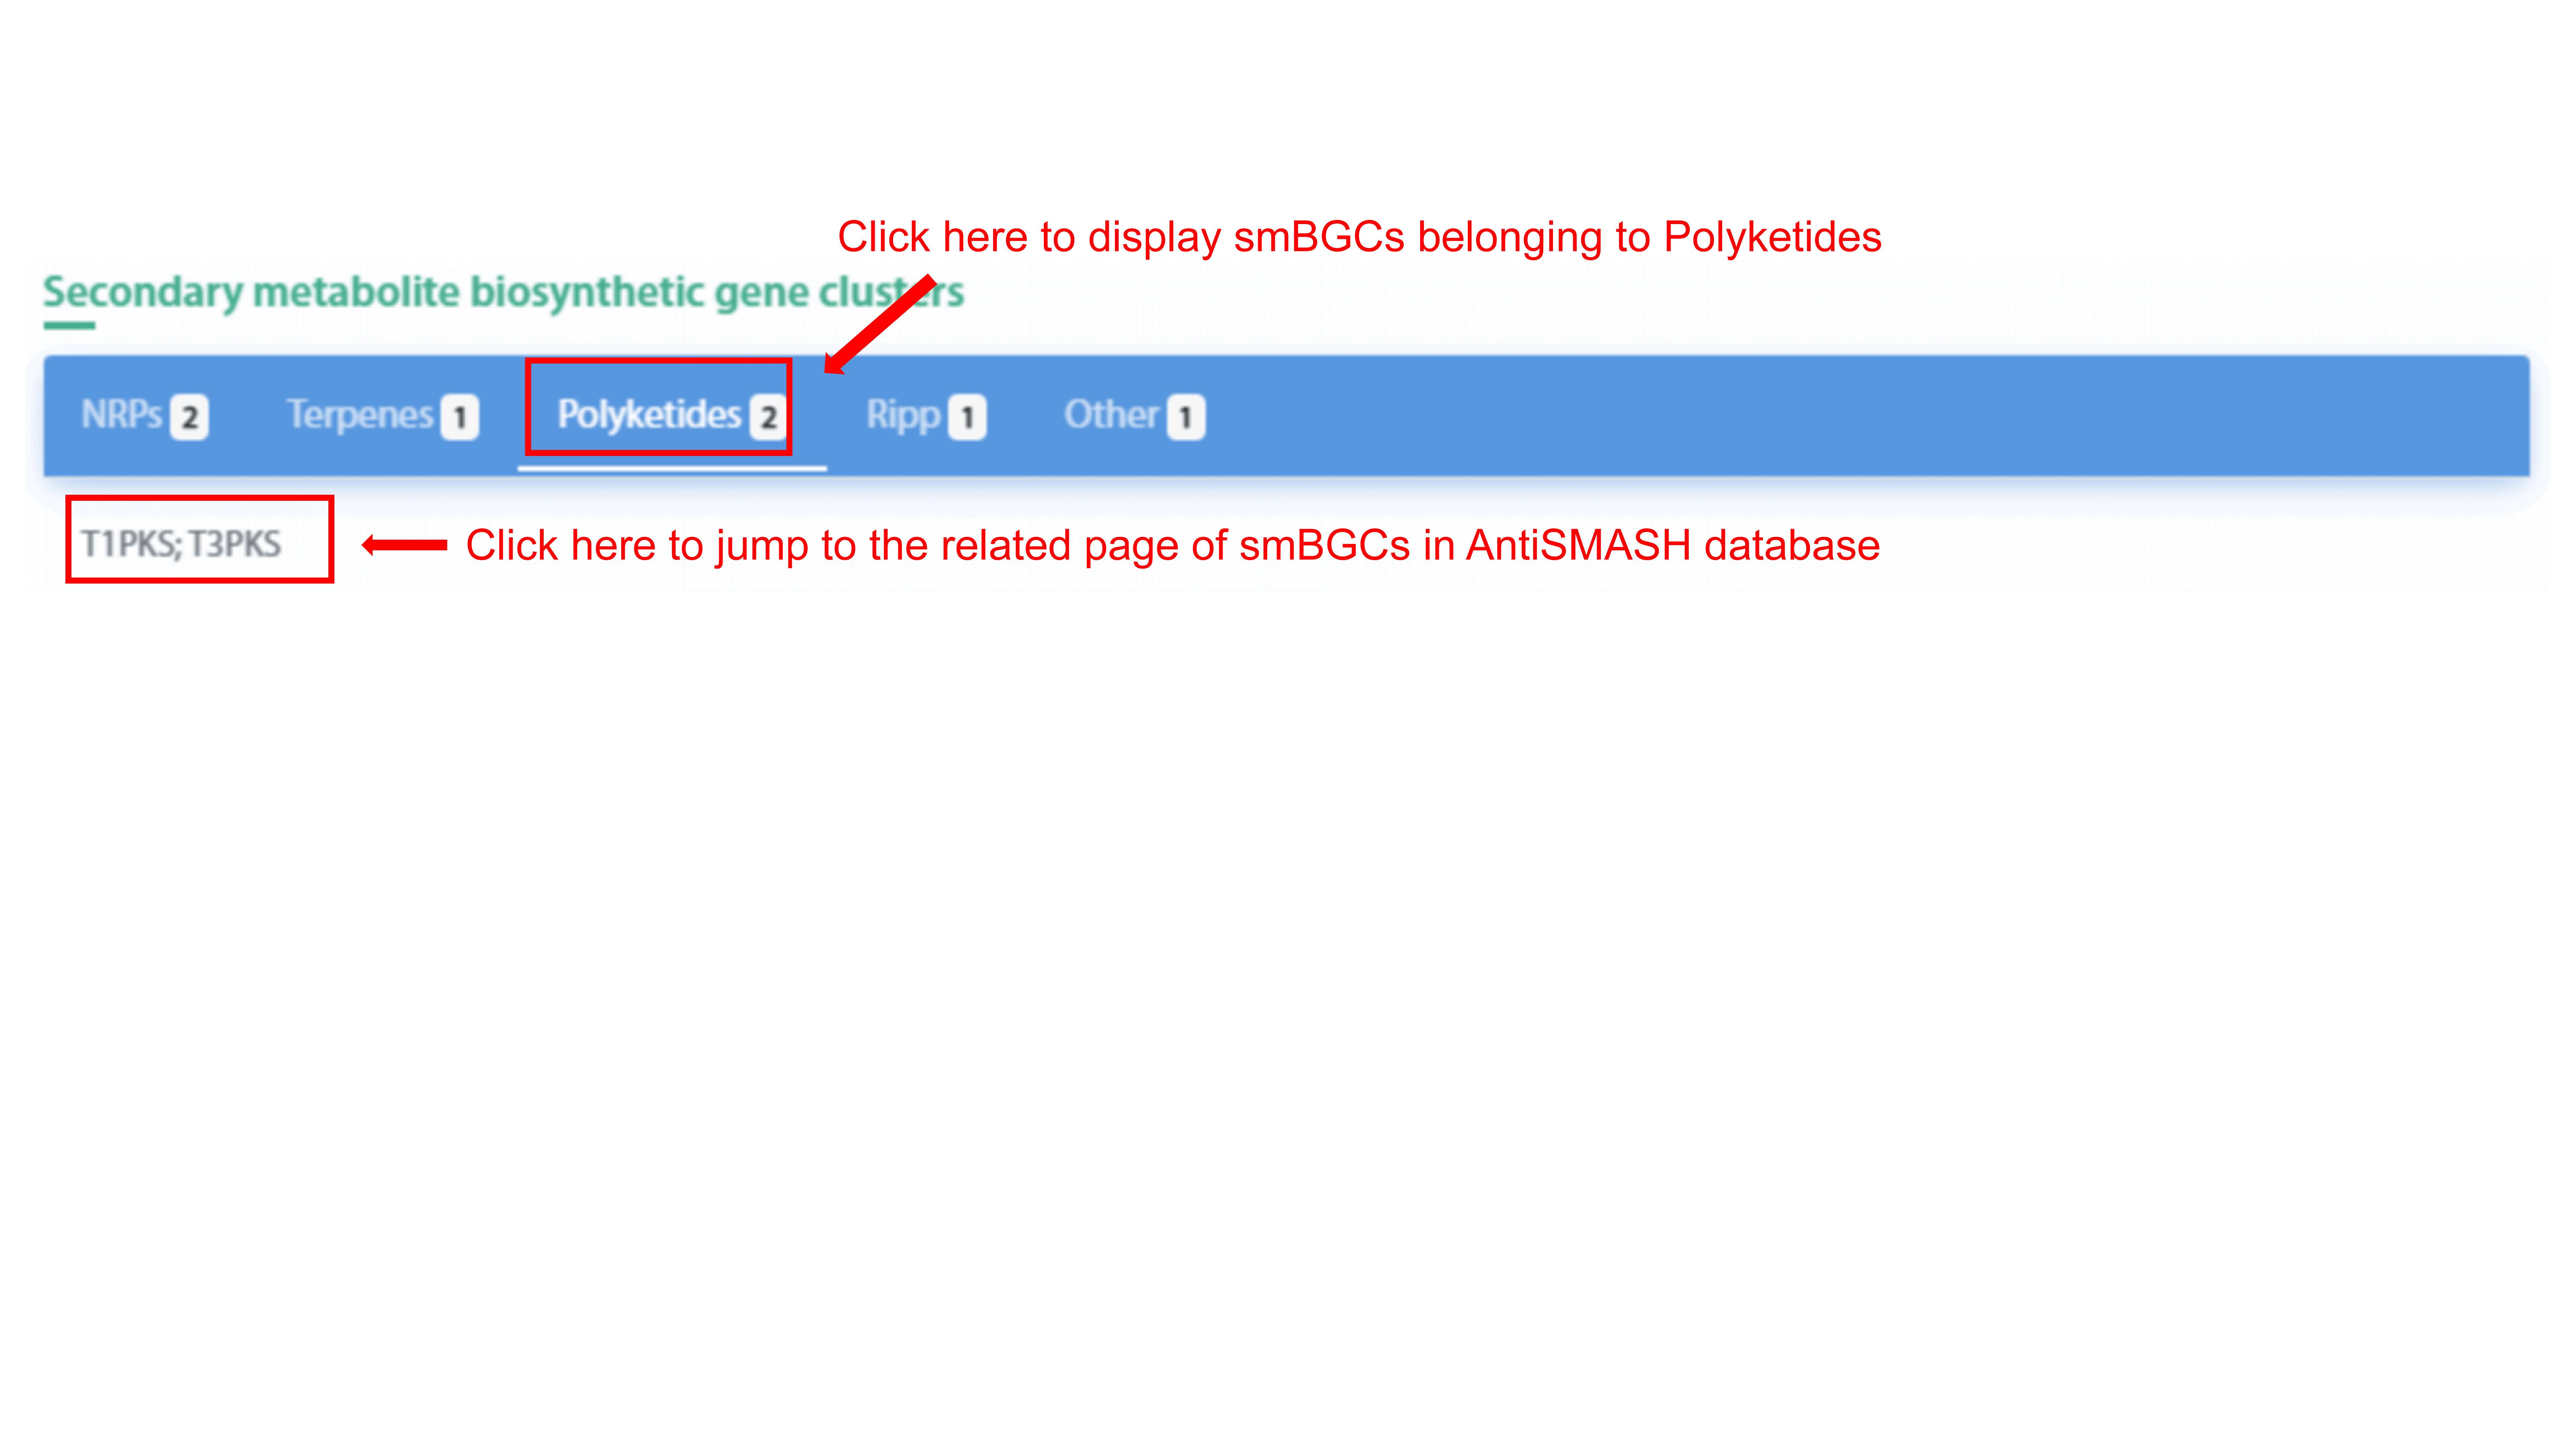
Compound-related phenotypes section includes KEGG
metabolites, MetaCyc metabolites, and secondary metabolite biosynthetic gene
clusters (smBGCs). KEGG Metabolites and MetaCyc Metabolites both use heatmap chart
to display compound and related number of pathway. User can show different range of
pathway count in the strain by clicking the legend. By clicking each spot in the
heatmap, user can see the name of metabolite and related pathway count in the
strain. In addition, the detail information of this metabolite will display in the
table below. User can go to the related metabolite page and pathway page of each
database by clicking metabolite name and pathway name, respectively.
The tab chart displays all smBGC classes of the
strain. User can view all smBGCs in this class by clicking each tab. User can go to
the smBGCs page in AntiSMASH database by clicking smBGC name.
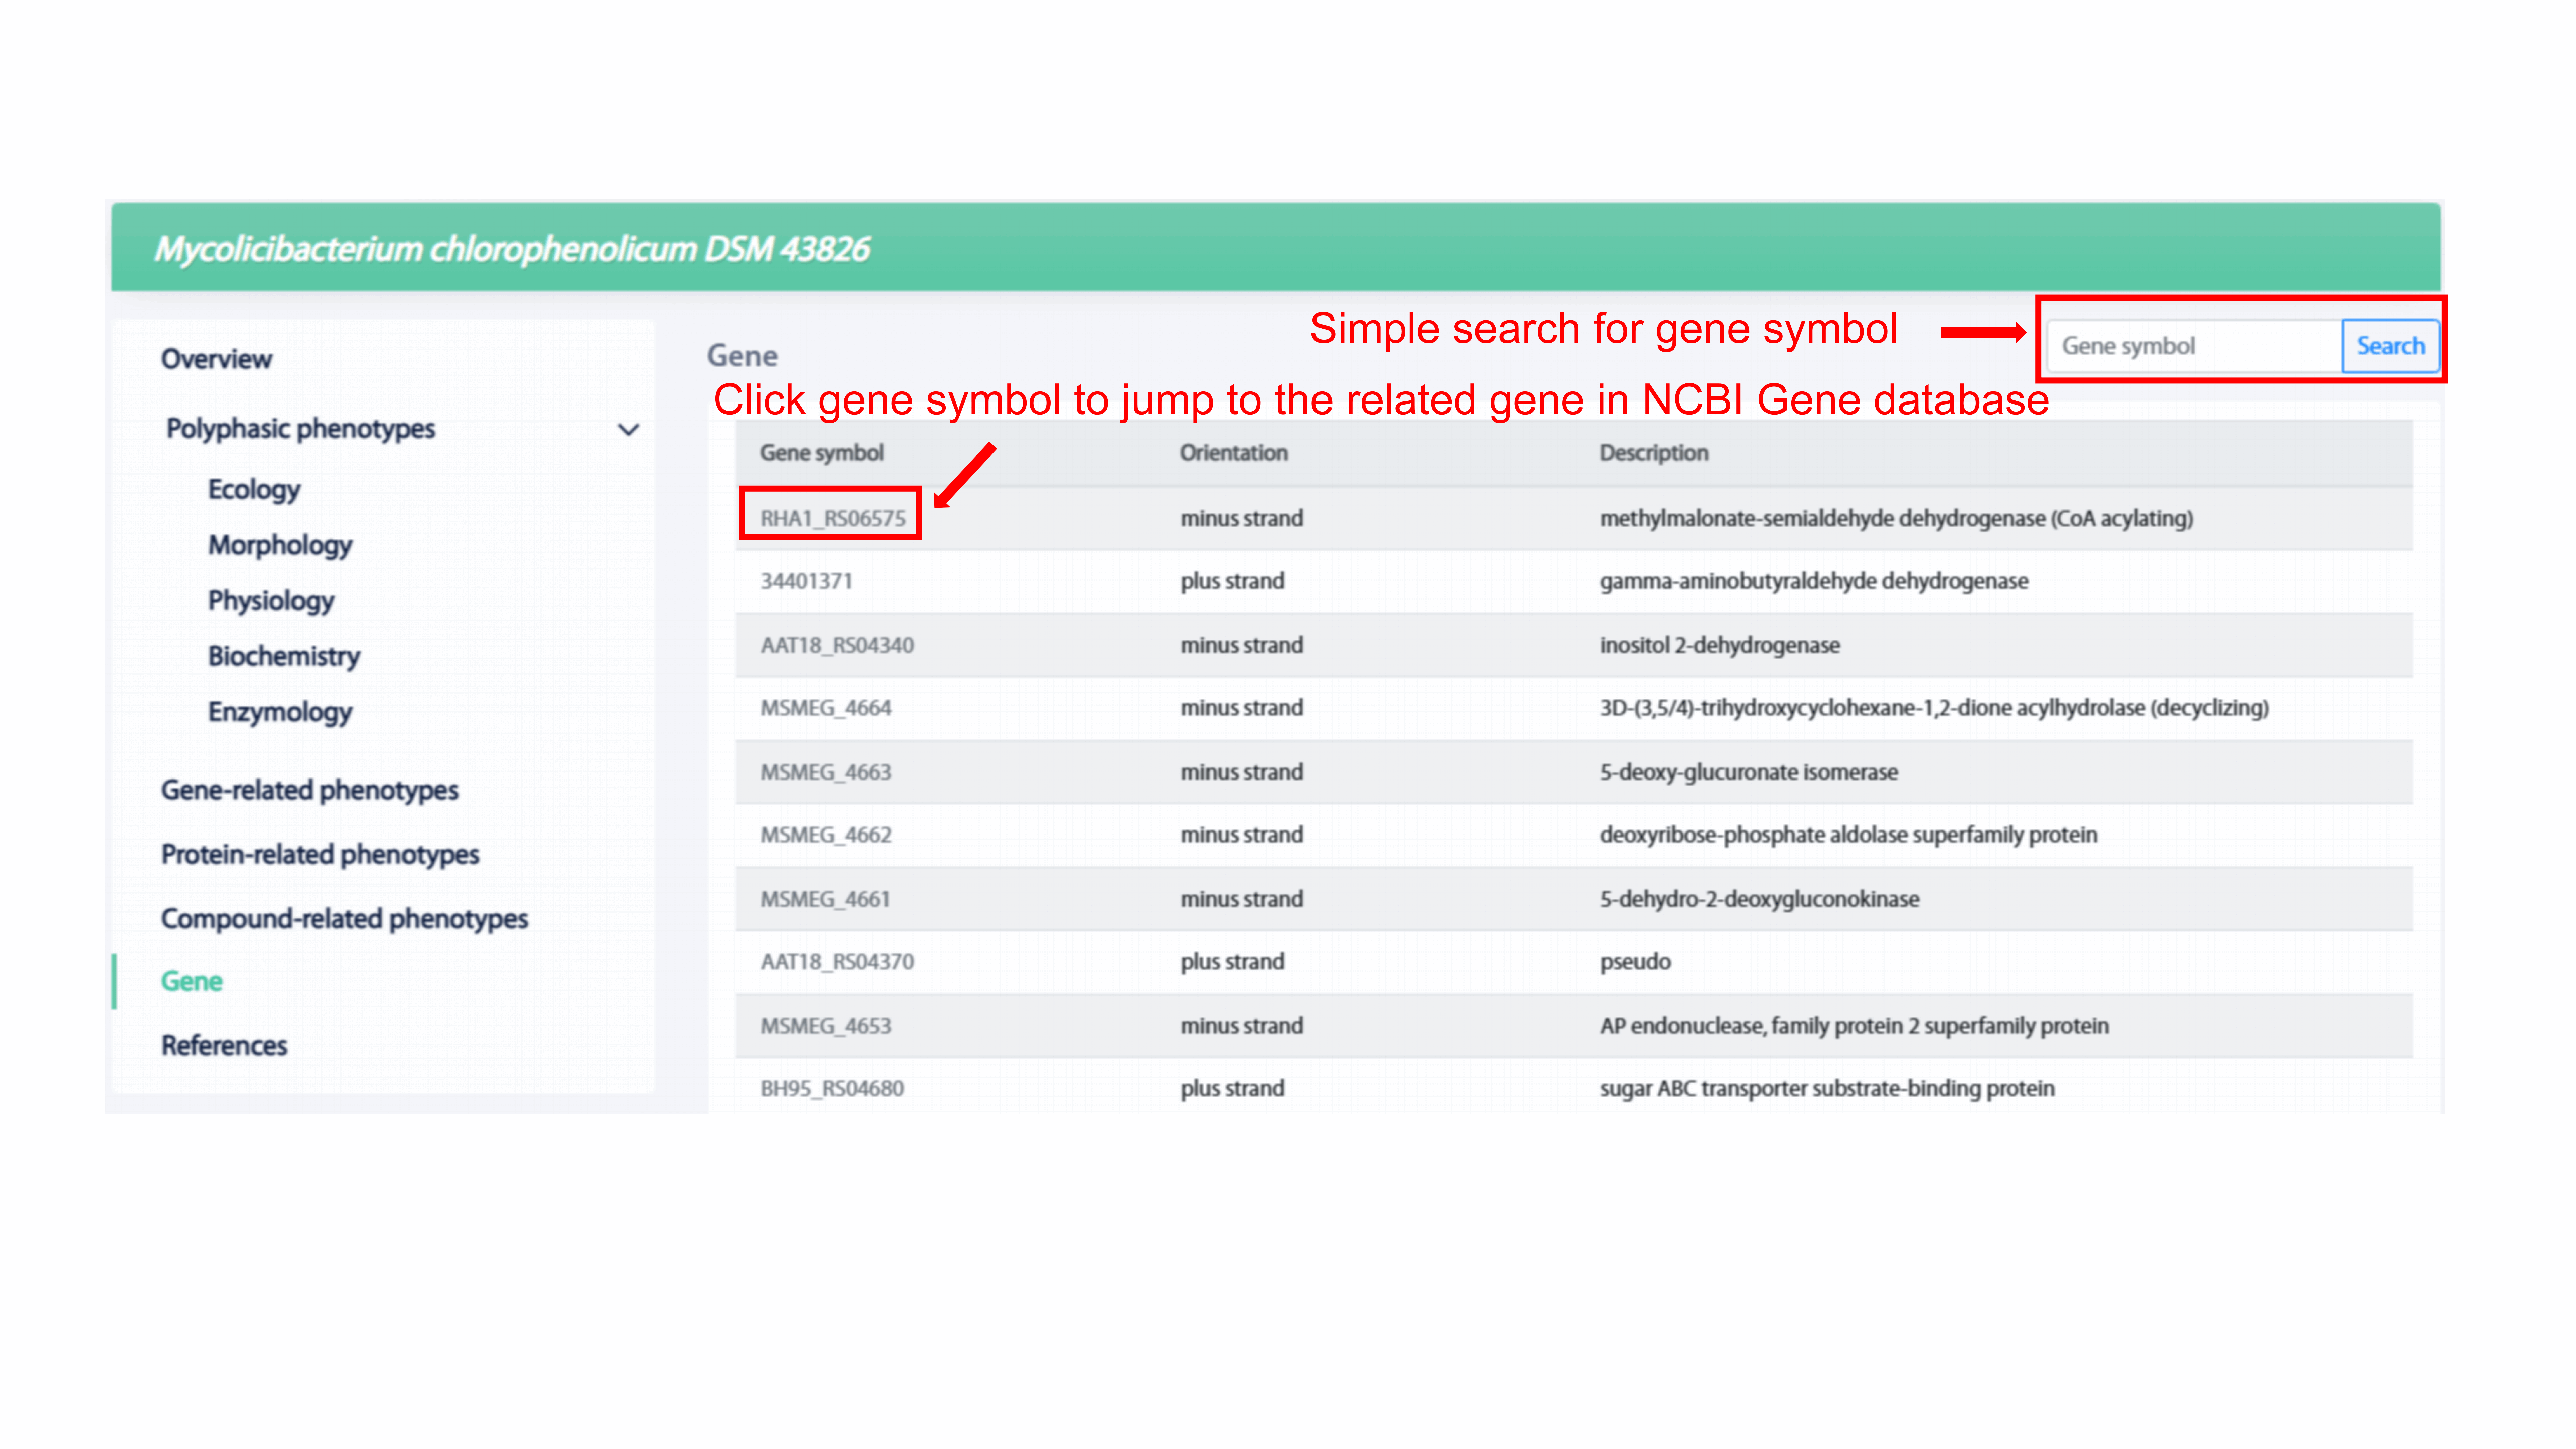
MPA provides the list of genes existed in the strain
in the Gene section. User can get gene-related information including gene symbol,
orientation, and description. User can use simple search which supports the fuzzy
queries of gene symbol to search for the gene of interest. In addition, user can
reach the detail of the corresponding gene in NCBI Gene database by clicking the
gene symbol.
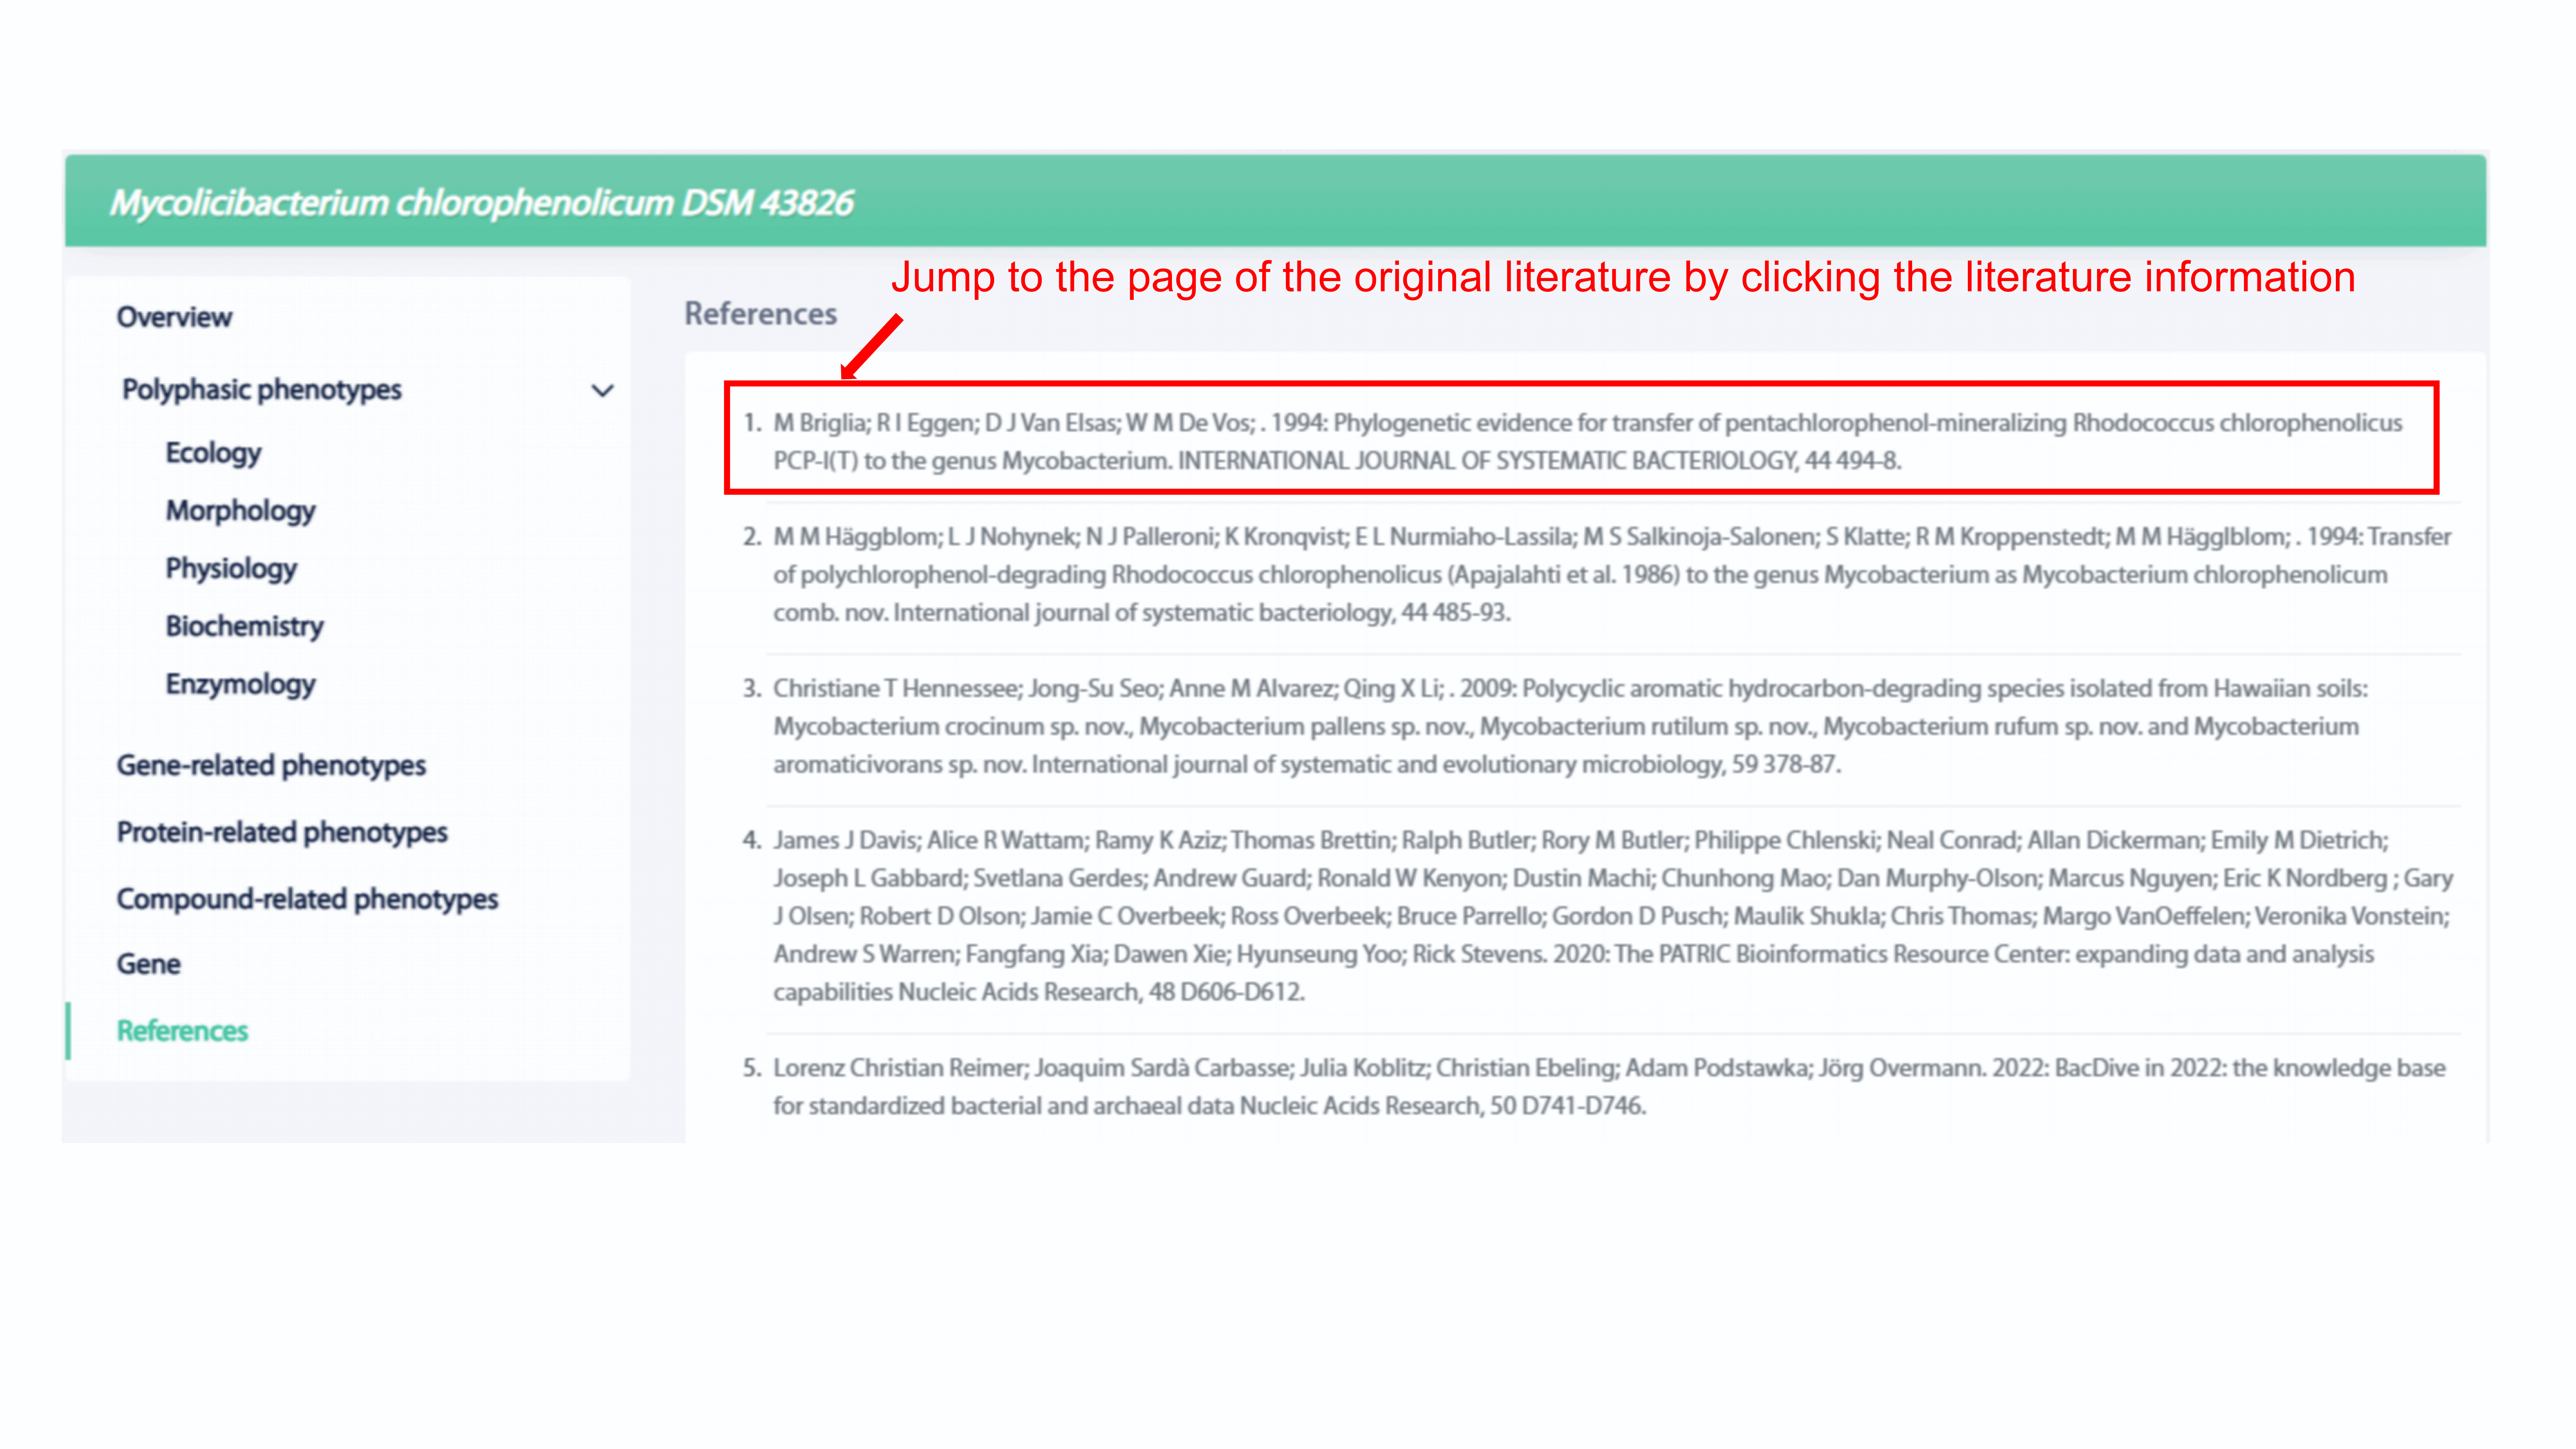
MPA provides the list of literatures for the curated
phenotypes of the strain in the references section. User can get literature-related
information including author, title, journal, and publication time. User can reach
the page of original literature by clicking the literature information.
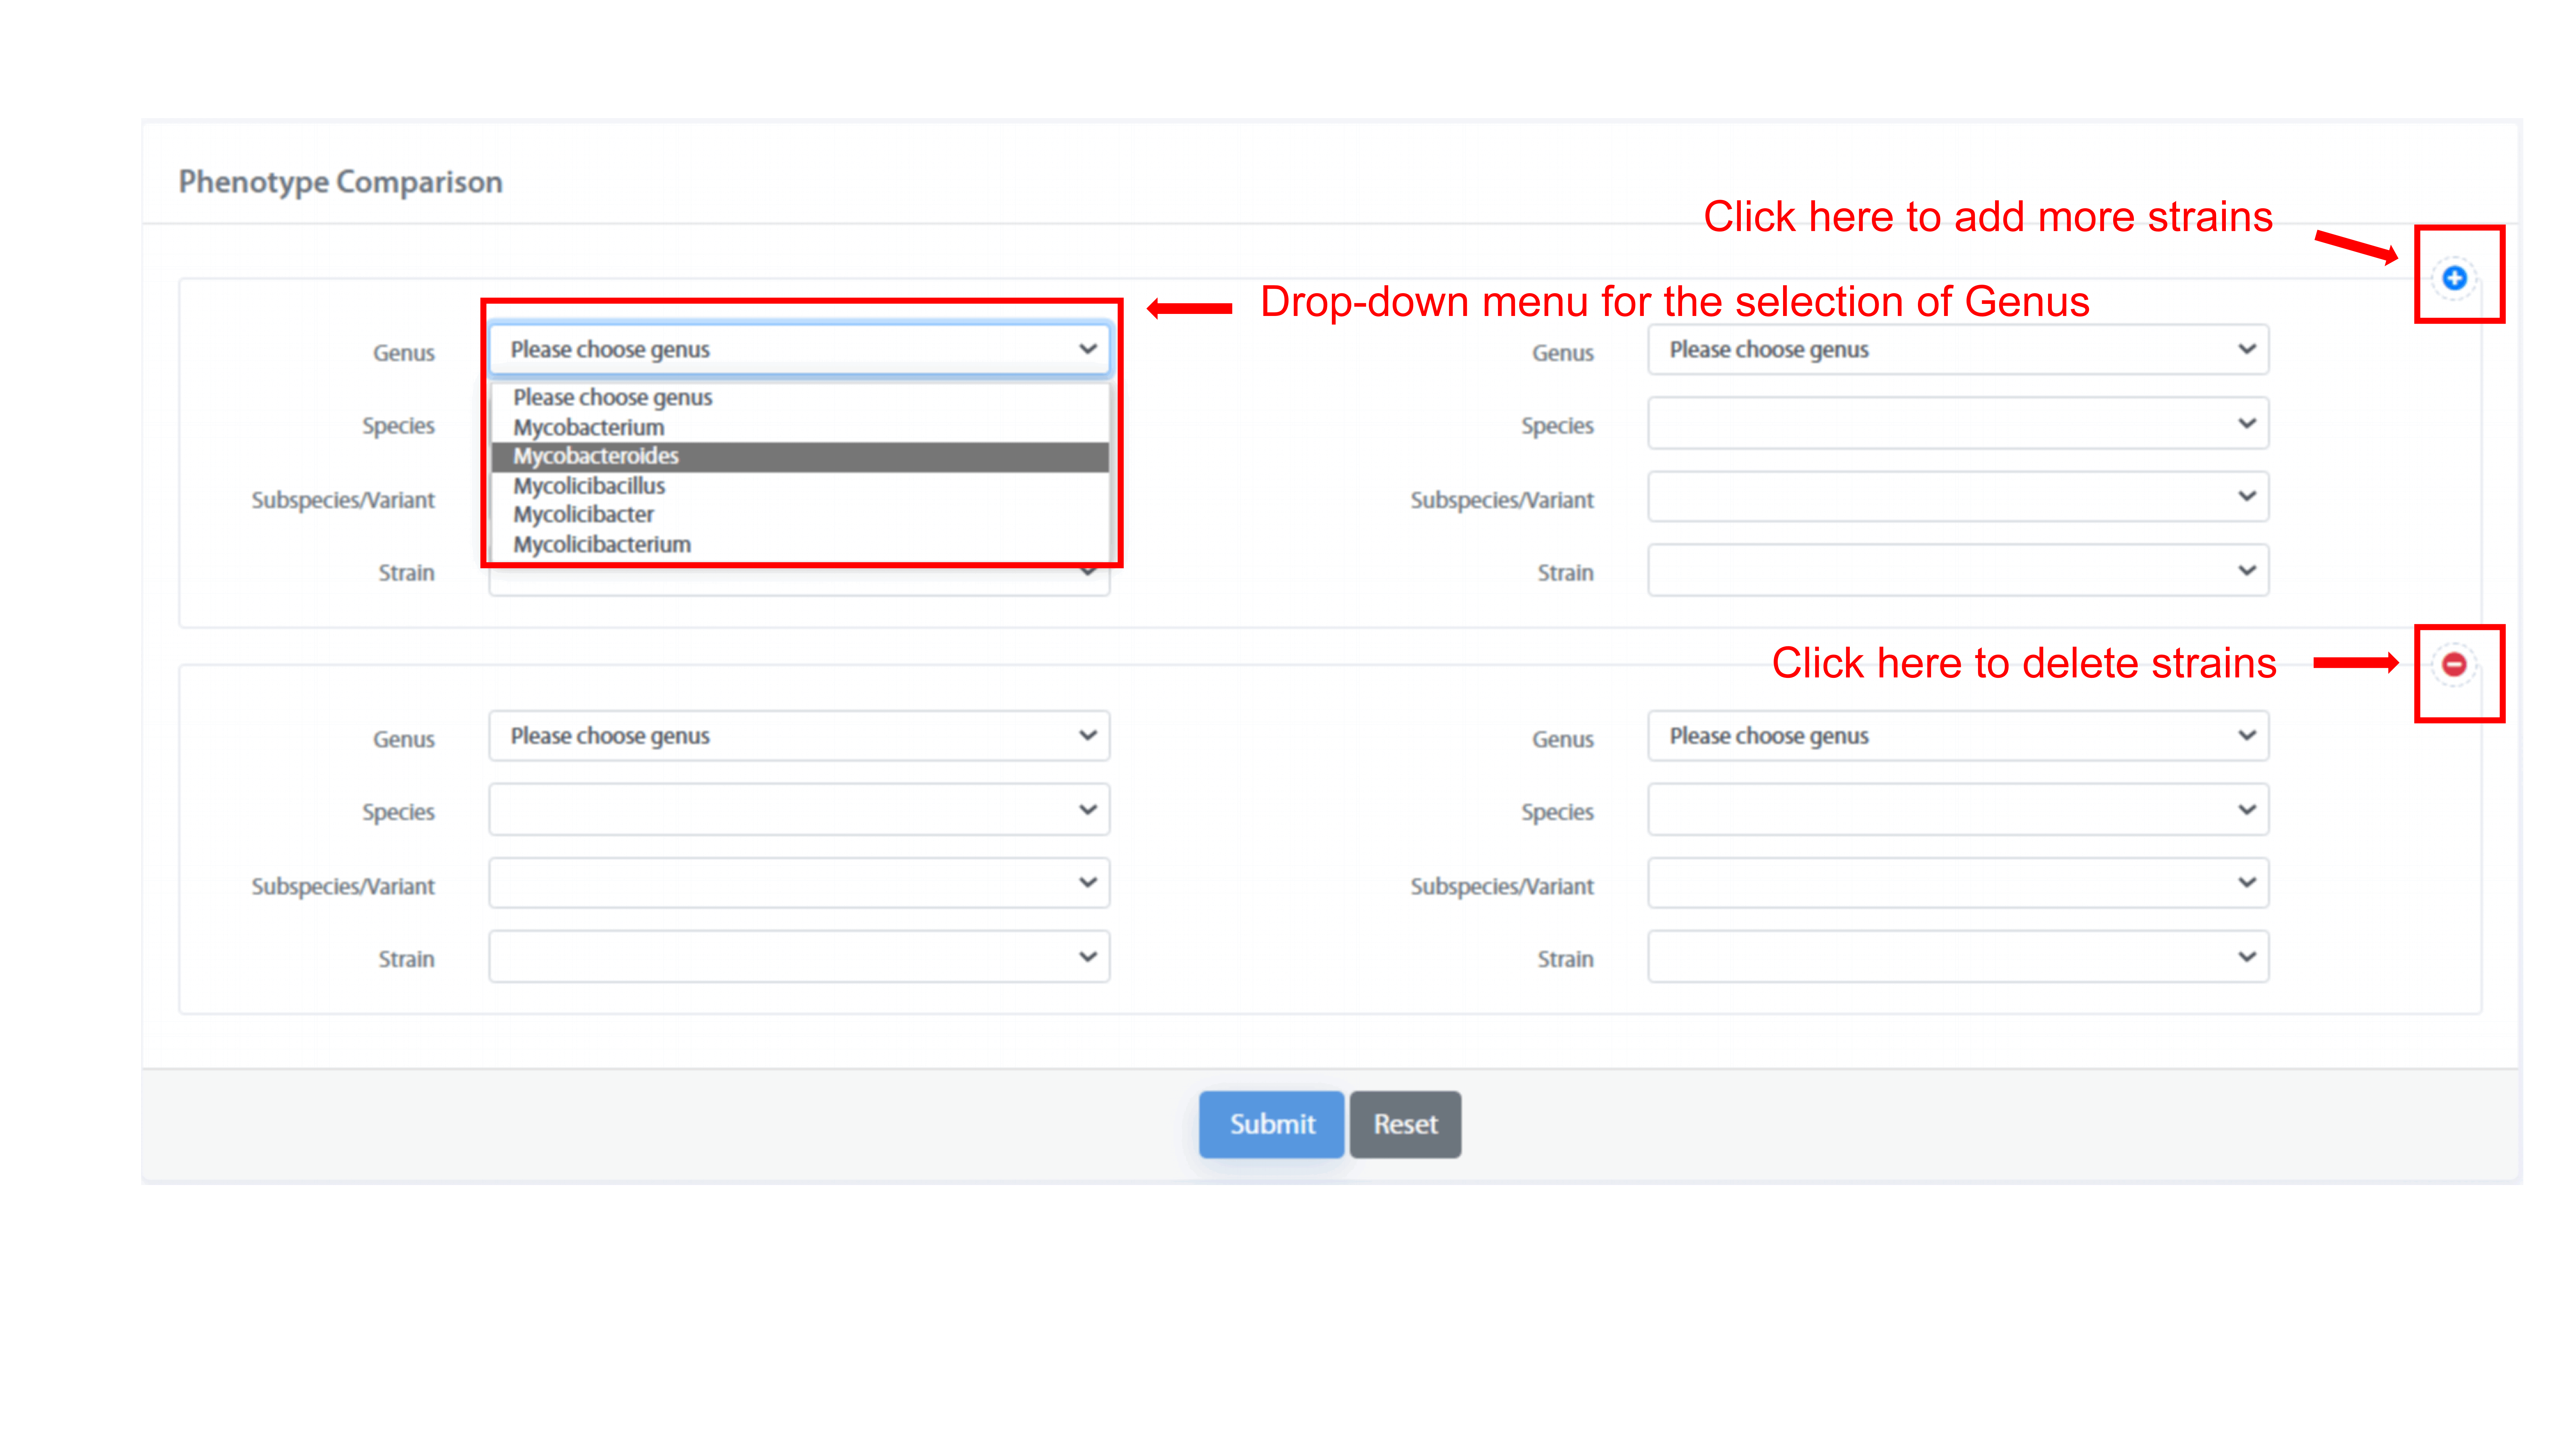
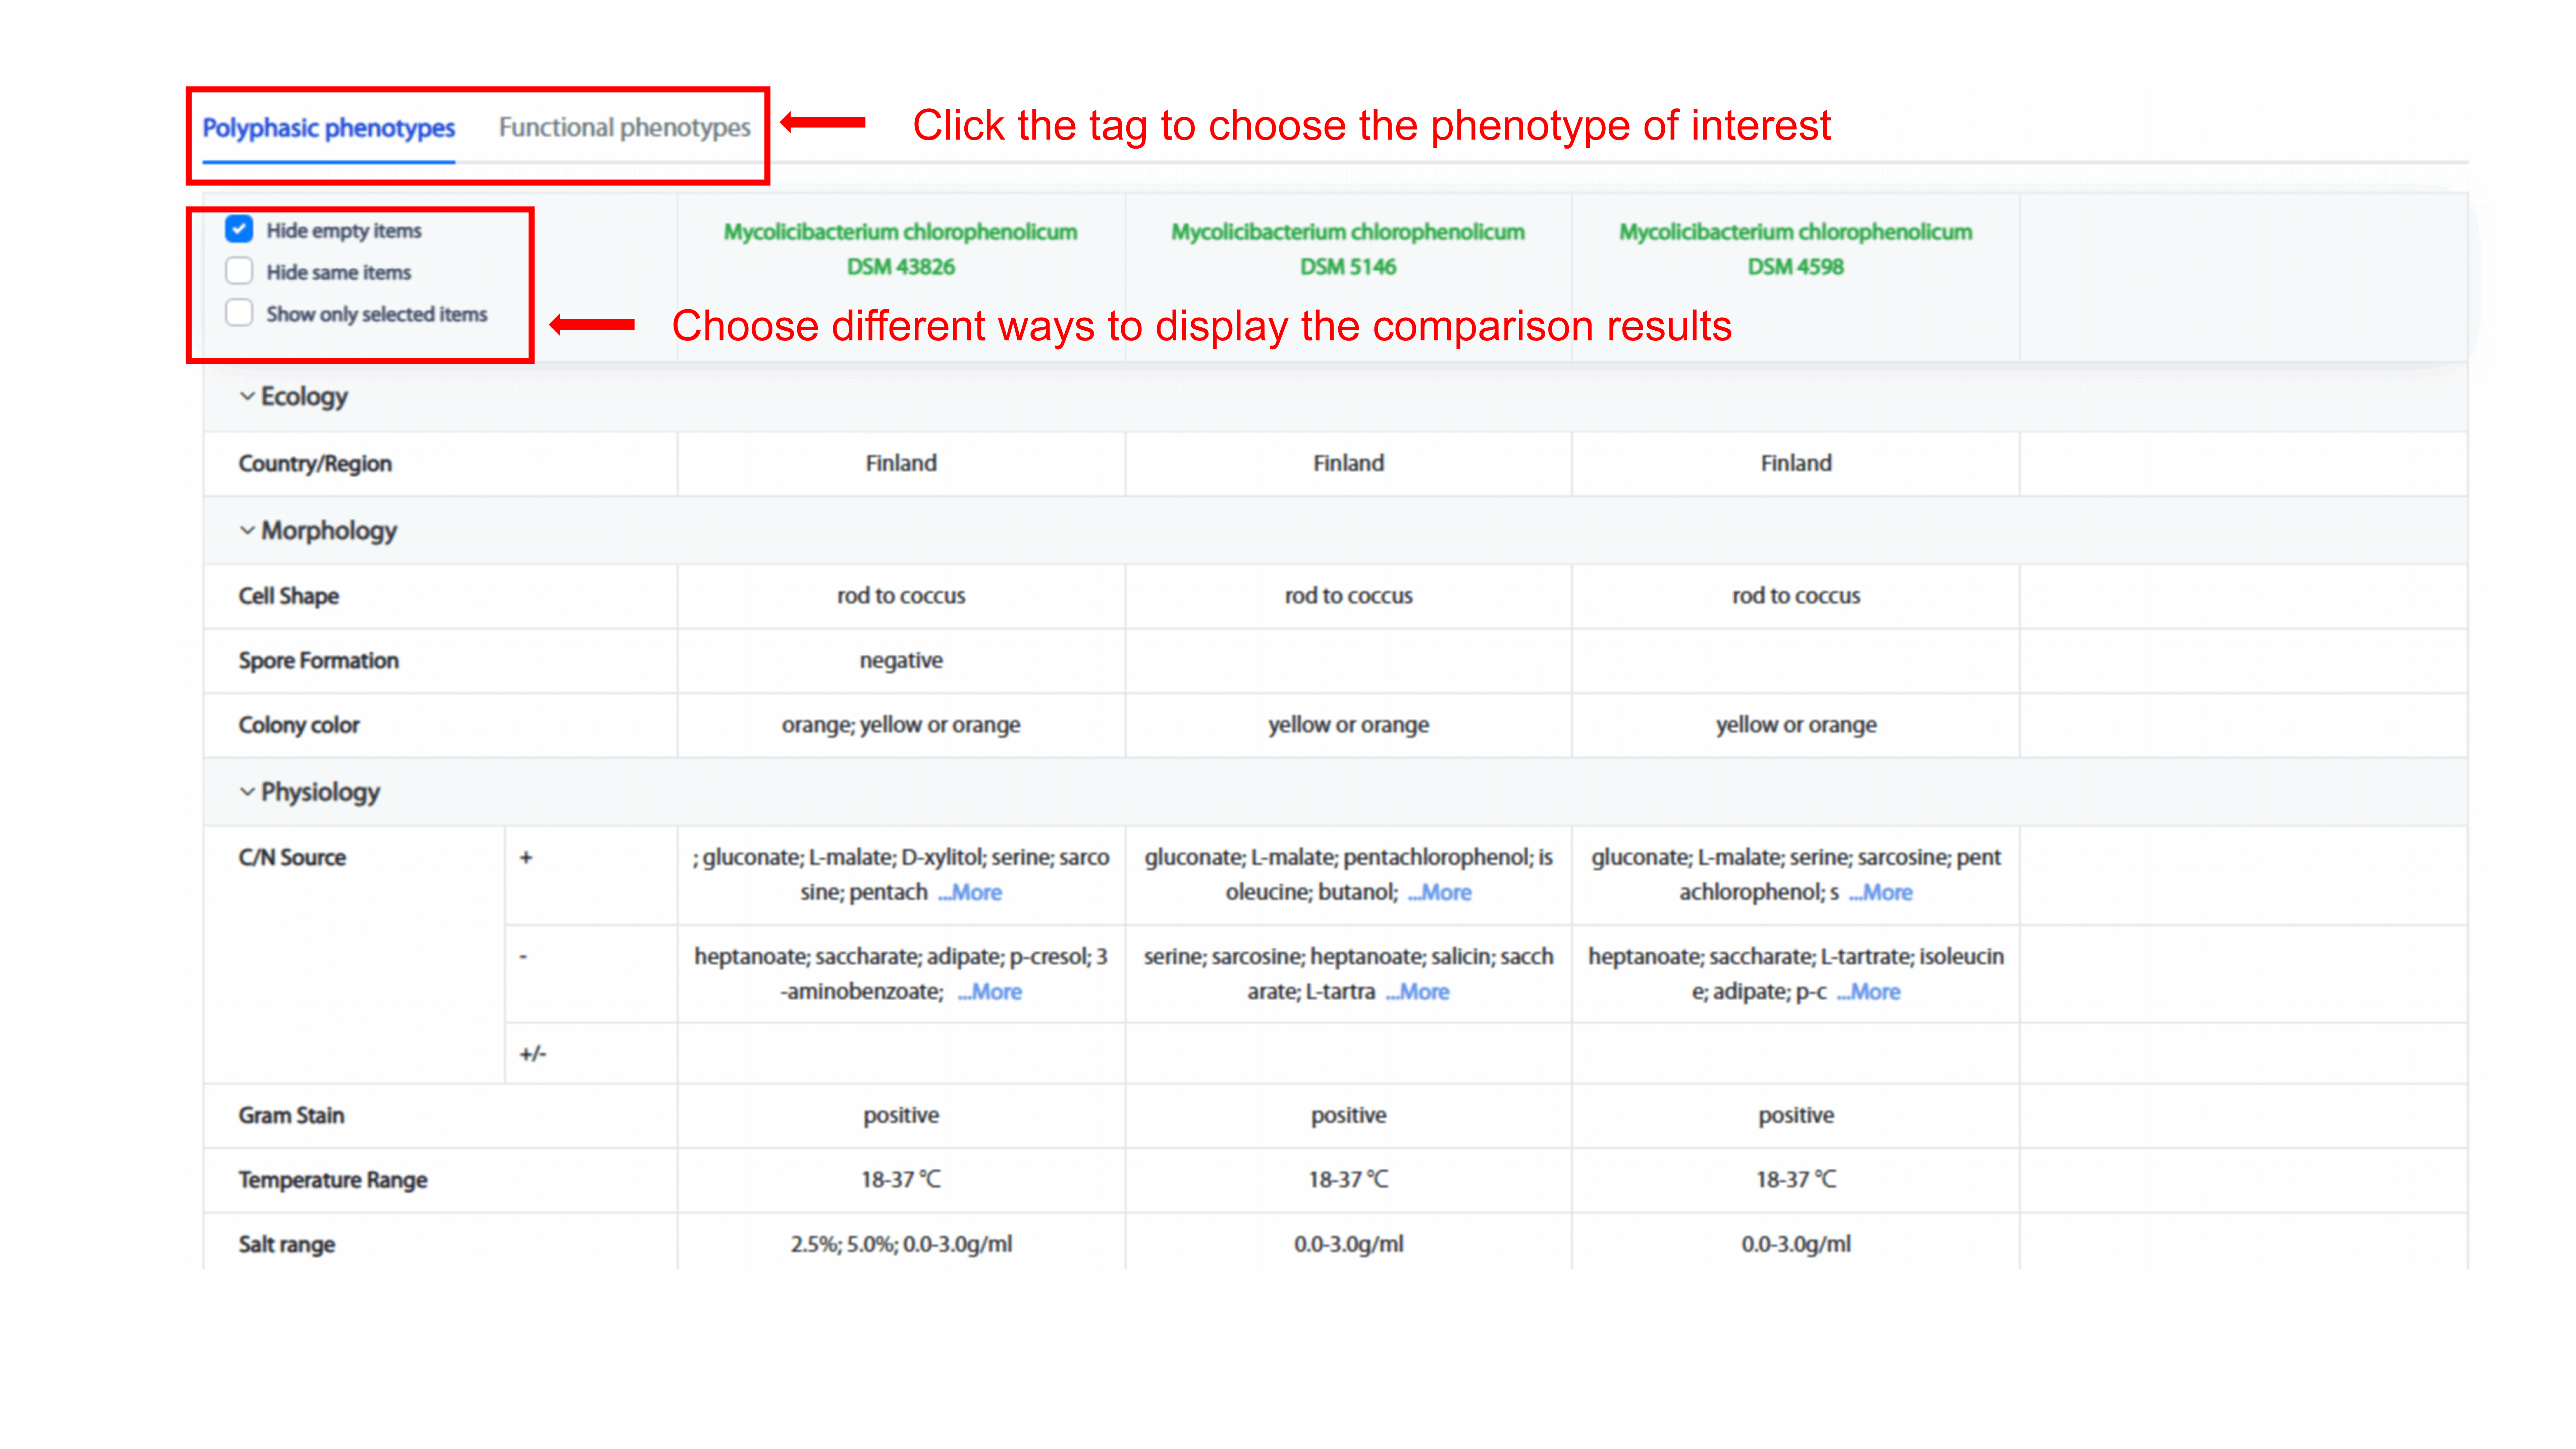
Phenotype Comparison
Phenotype Comparison page supports the comparison of phenotypes with a maximum of
four strains in one table. MPA provides the drop-down menu for the name of genus,
species, subspecies/variant, and strain. According to drop-down menu, user can
choose strains of interests, and compare the differences of polyphasic phenotypes
and functional phenotypes among strains.
41 phenotypes from either polyphasic phenotypes or functional phenotypes are
displayed one by one. The resulting display supports "Hide empty items", "Hide same
items", and "Show only selected items." If user select "Hide empty items",
phenotypes that don’t exit in any of the compared strains are undisplayed. If user
select "Hide same items", phenotypes that are the same among all compared strains
are undisplayed. If user select "Show only selected items", user can expand and
review the phenotype of interests.
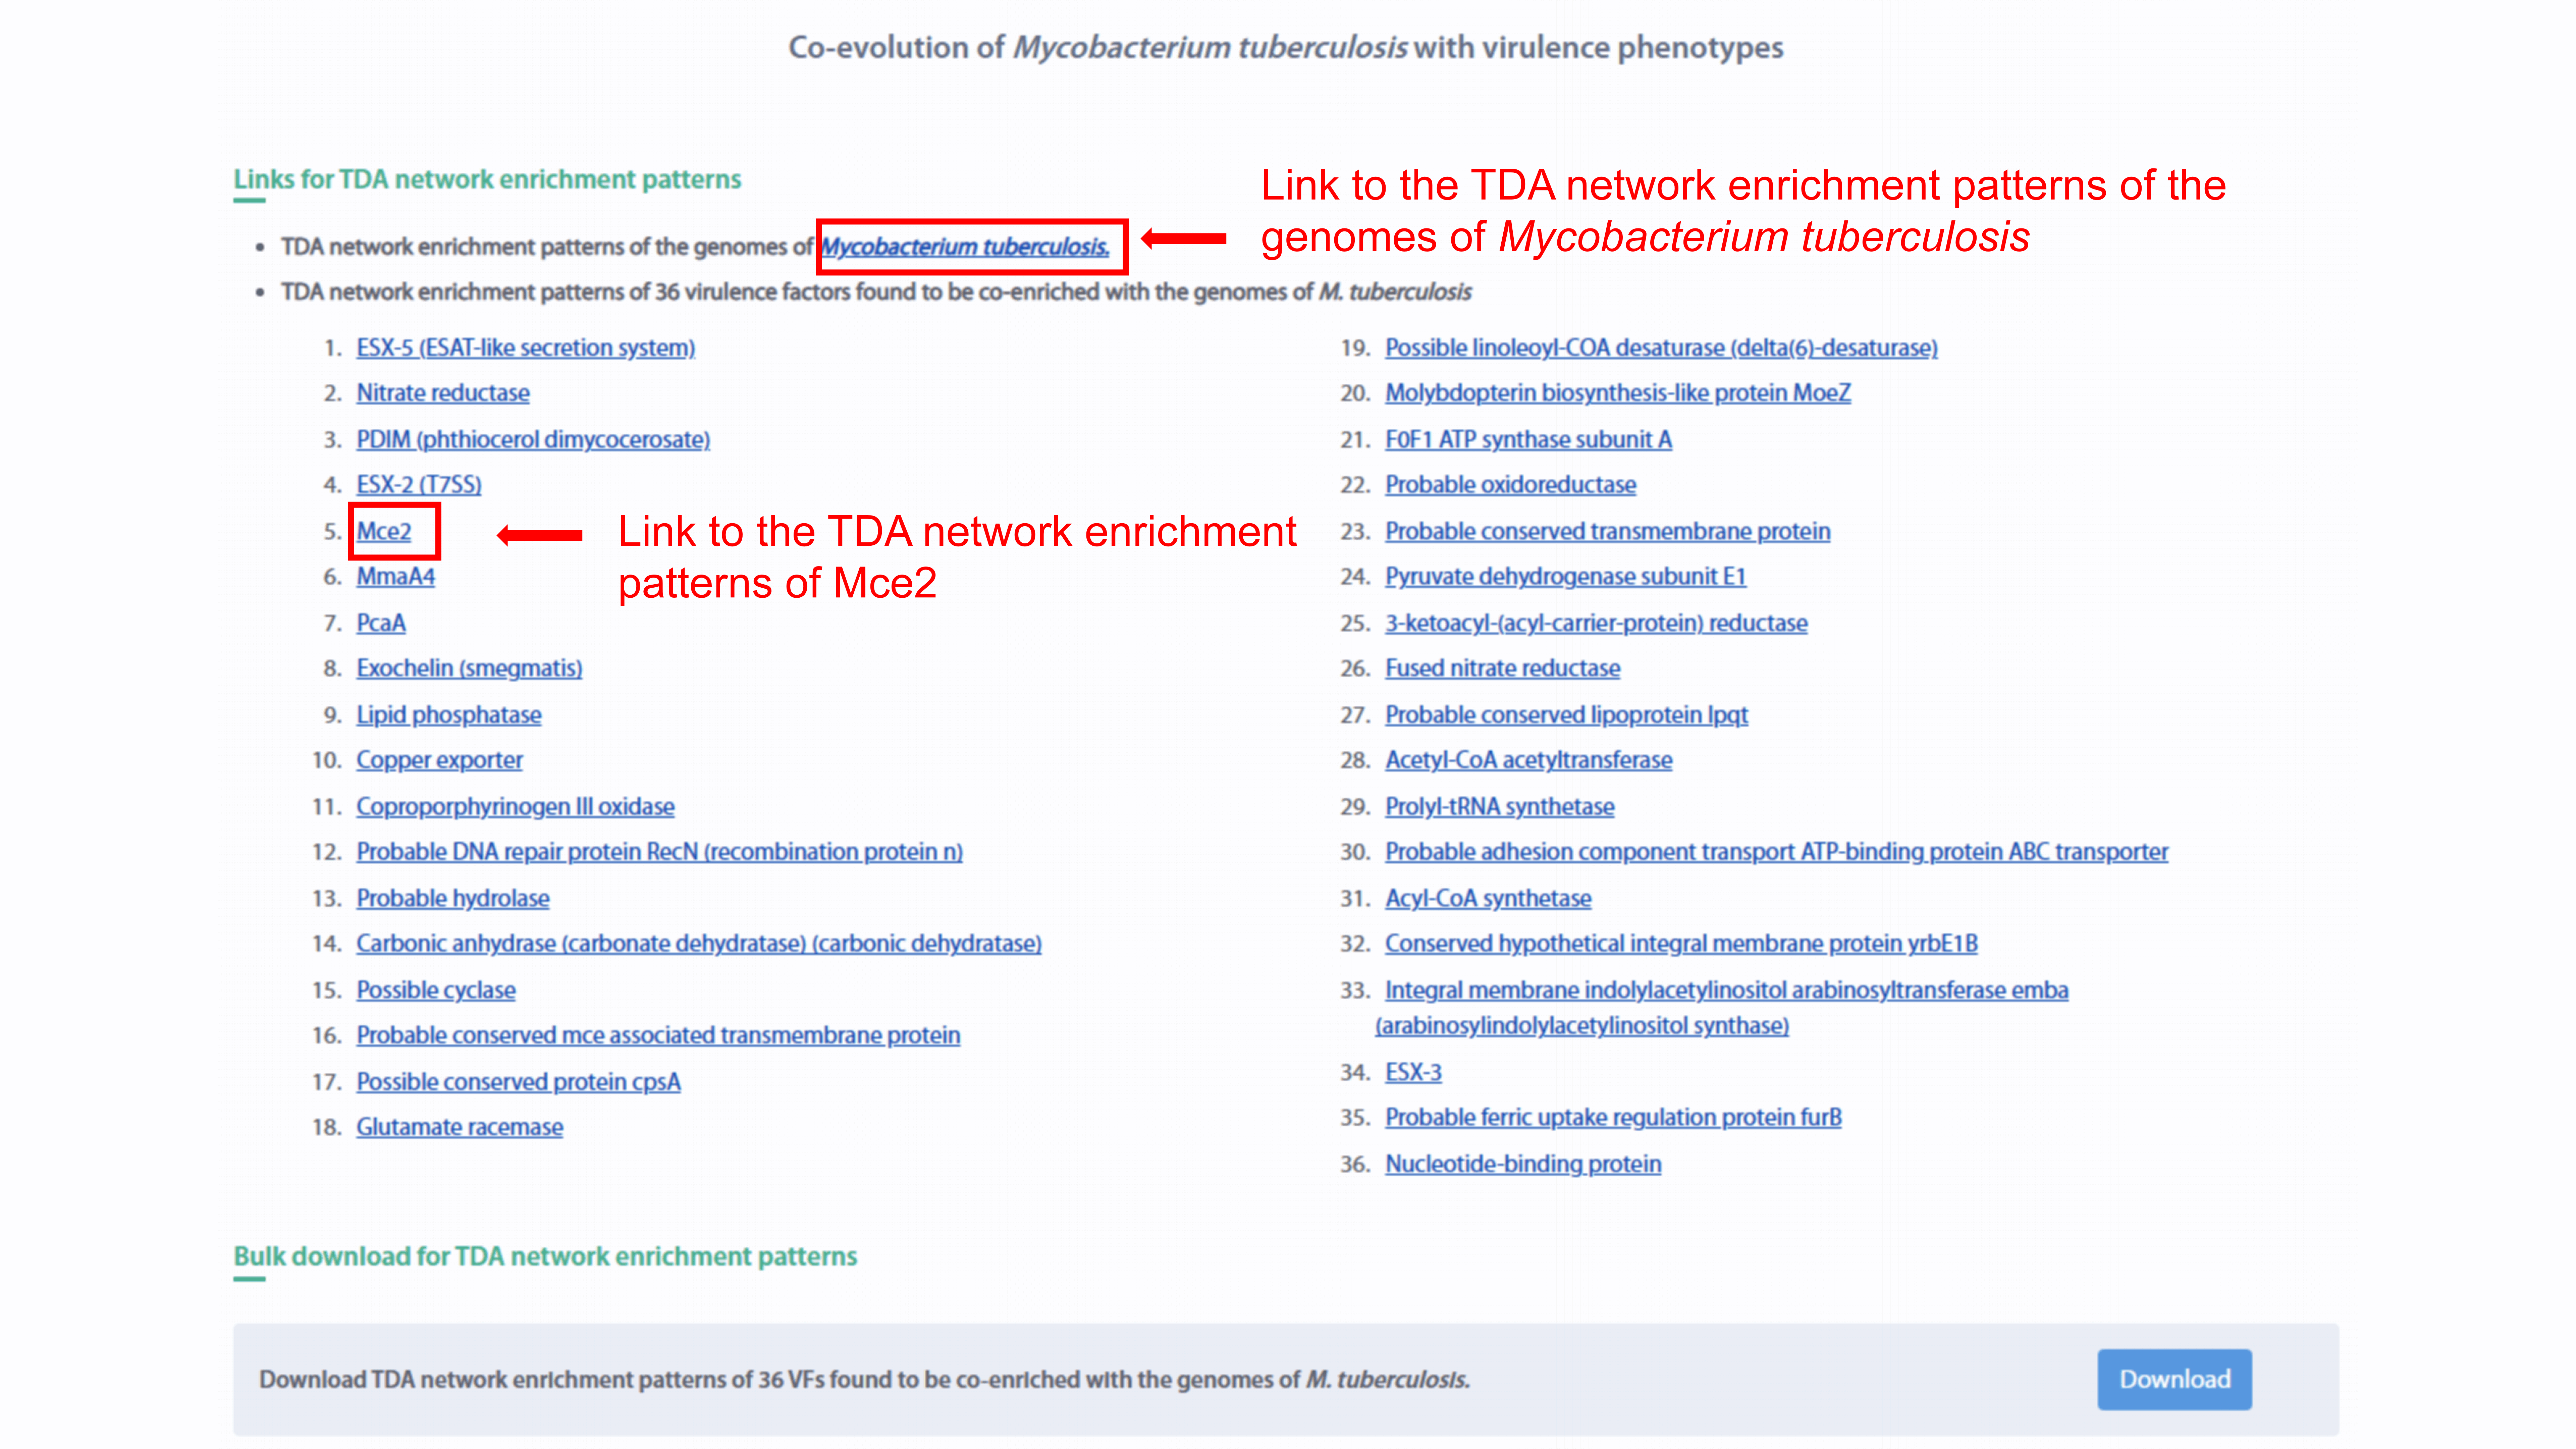
Co-evolution
The co-evolution analysis results of Mycobacterium tuberculosis with virulence
phenotypes are provide in the co-evolution page. The individual link and bulk
download for TDA network enrichment patterns of M. tuberculosis and 36 VFs are also
supplied.
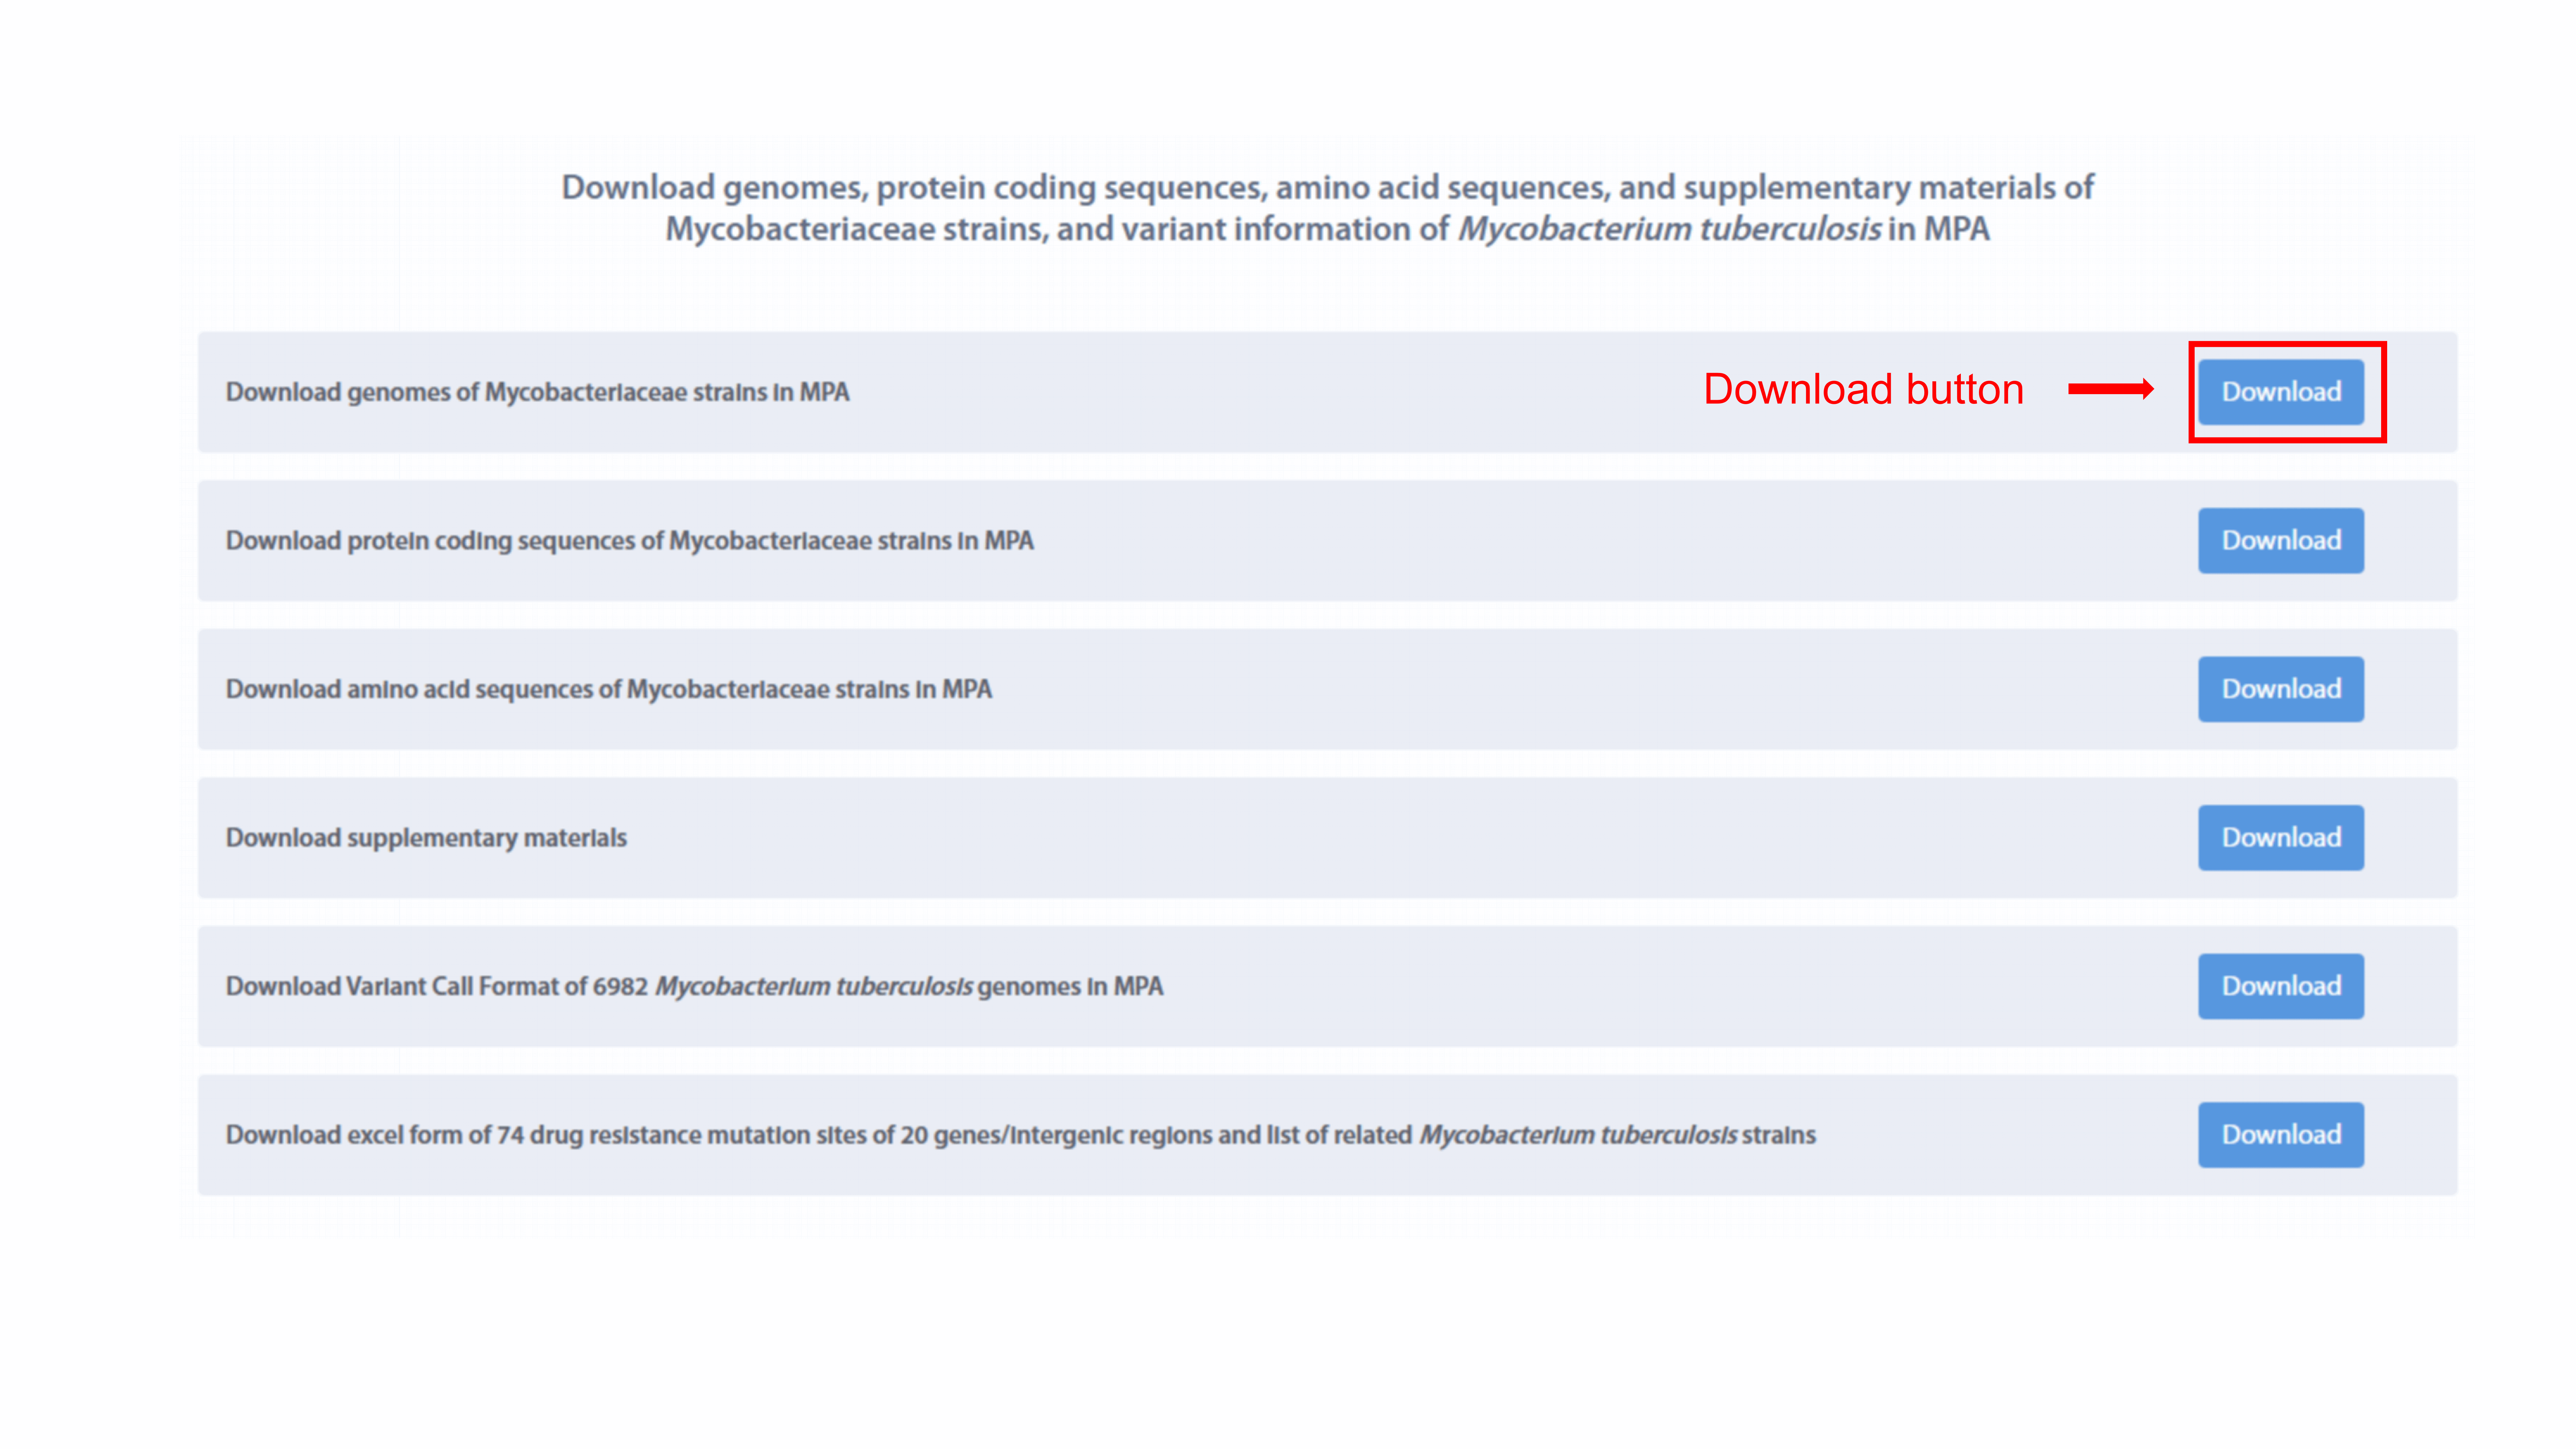
Download
Download page provides the download of genomes, protein coding sequences, amino acid
sequences, and supplementary materials of Mycobacteriaceae strains, and variant
information of Mycobacterium tuberculosis in MPA. User can download the data of
interest by clicking the download button.