Introduction
Single cell RNA sequecing(scRNA-seq) provides a high-throughput way to study gene expression profile for one single cell in order to keep unique cell signal away from being concealed by group.
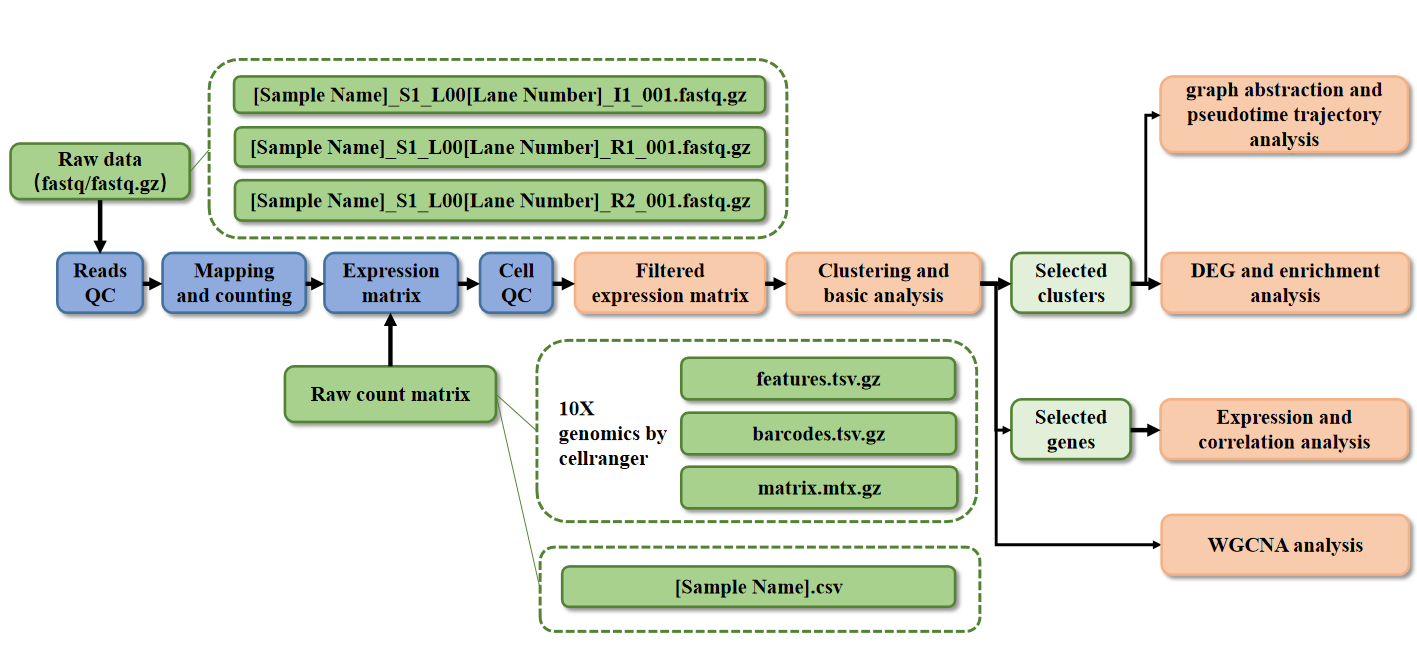
For this models, we will provide a pipeline to analyse scRNA-seq dataset from 10X Genomics as below.
Pipeline
10X genomics
This pipeline starts by reading in the raw fastq data and return a unique molecular identified(UMI) count matrix.
Then we use the count matrix for post preprocessing. During post preprocessing, the input count matrix will be filtered, normalized and reduced dimension first.
Tools
Clustering and basic analysis
For filtered expression matrix, choose appropriate principle components for t-SNE cluster and detect the possible cell type of each cluster by measuring the expression level of marker genes.
After annotate each cluster, calculate the correlation between clusters and reveal the cell proportion of each cluster.
graph abstraction and pseudotime trajectory analysis
After clustering and basic analysis, we provide an interpretable graph-like map of the arising data manifold by estimation connectivity of manifold partitions to resolve differentiation relations among cells.
Besides, pseudotime trajectory is available to show the way of cells transition from one functional "state" to another by learning the sequence of gene expression changes each cell must go through as part of a dynamic biological process.
DEG and enrichment analysis
Calculate different expression genes(DEG) for chosen clusters and estimates variation of pathway activity of this DEGs over a sample population in an unsupervised manner.
Expression and correlation analysis
Visualise the distribution and the probability density of scRNA-seq expression data for chosen genes in different clusters and calculate the correlation of cells through the chosen genes.
WGCNA analysis
Weighted Gene Co-expression Network Analysis (WGCNA) analyzed gene expression patterns in multiple cells, which can cluster genes with similar expression patterns. And analyze the correlation between modules and cell types.