Introduction
WGBS, also known as whole genome methylation sequencing, uses bisulfite to treat genomic DNA to convert unmethylated cytosine C to uracil U. By resequencing the treated DNA and comparing it with the reference genome, it can achie'e single-base resolution and high precision methylation level analysis at the genomic level.
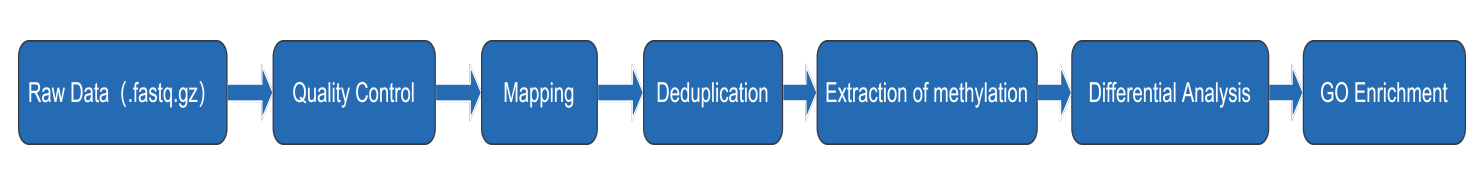
The pipeline can automatically analyze WGBS sequencing data and generate a series of visual graphs and result files. In this pipeline, both human and mouse species are supported. The pipeline consists of seven analysis steps. Quality analysis of raw sequencing data was first performed using FastQC software. The raw sequencing data were then quality controlled using Trimmomatic software. The quality of the data after quality control was analyzed again using FastQC. Bismark software was used for sequence alignment, deduplication and methylation information extraction after quality control. There are three contexts in the WGBS analysis, CpG, CHG and CHH. Batmeth2 software is used to partition the sequencing data into windows and obtain the average methylation levels of different contexts in different windows.
We decompressed the Bismark processed files and then converted them into the input file format of the R package DSS. After obtaining differentially methylated locis (DMLs) and differentially methylated regions (DMRs) using the DSS package, we annotated the DMRs based on the ChIPseeker package and provided visual analysis results.
The schematic diagram of WGBS pipline is as follows :
Software and references:
- FastQC: Used for quality inspection of WGBS data
- Trimmomatic: Flexible trimmer for WGBS data.
- Bismark: Used for alignment, deduplication and extraction of methylation information from WGBS data.
- Batmeth2: Used for calculated the methylation levels of the three contexts in different regions of the WGBS data.
- DSS: An R package for extracting differentially methylated sites and differentially methylated regions between the two groups.
- ChIPseeker: An R package for annotation and visualization of differentially methylated regions.