Welcome to our case study page for xMarkerFinder! At the forefront, It’s worth highlighting that xMarkerFinder is designed as a standard protocol with a high level of impartiality when it comes to microbial habitat and even data type. Our commitment is to offer a method that is not only universally applicable but also transcends the constraints of specific data categories, effortlessly catering to a rich spectrum of data types.
To provide a clearer perspective on the versatility and breadth of xMarkerFinder, we've curated case studies that demonstrate its application across three distinct settings: the human gut microbiome, the human oral microbiome, the human transcriptome, and the ocean microbiome. Dive in to explore further!
Firstly, we provide a case study of our previously published work, and a subset of the original datasets are used here as the example input datasets. In detail, we collectively analyzed metagenomic data derived from seven geographically distinct cohorts to identify reproducible microbial biomarkers for the diagnosis of CRC.
After data preprocessing, we employed xMarkerFinder to conduct the differential testing between samples of CRC patients and controls within the discovery dataset. In total, 88 bacterial, 108 fungal, 38 archaeal, and 115 viral species exhibited significant differences in abundance between CRC and control groups. Based on differential signatures, we next performed feature selection, resulting in the identification of a minimal panel of 16 microbial biomarkers, including 11 bacterial biomarkers, four fungal biomarkers, and one archaeal biomarker. This biomarker panel showed remarkable diagnostic performance not only in single populations but also in multi-cohort settings (Fig. 1)
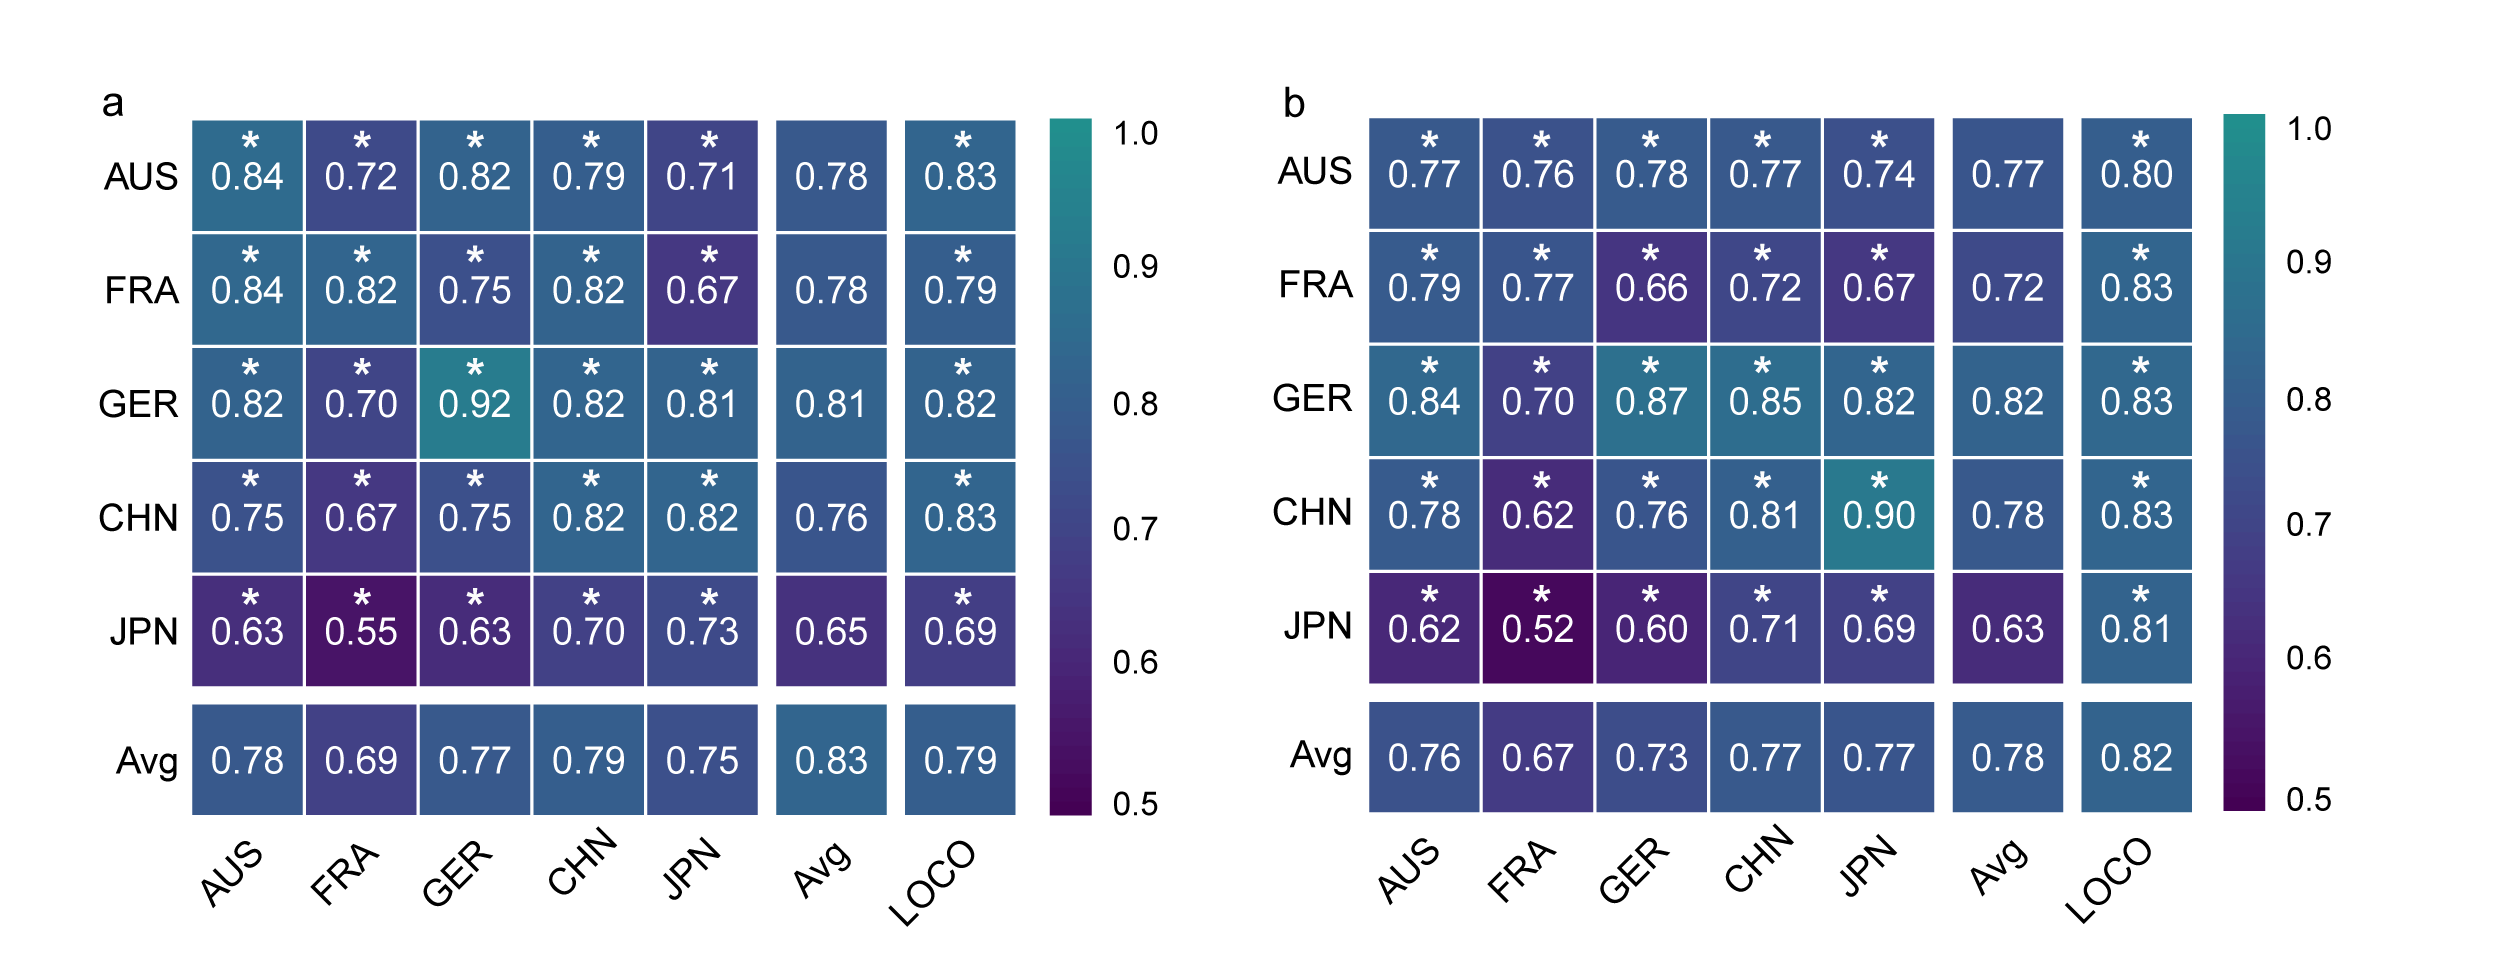
Fig.1 The performance of microbial biomarkers for the diagnosis of CRC. a, b, AUROC matrix of models built with the panel of 16 multi-kingdom features for CRC detection (a) and early-stage CRC detection (b). Values on the diagonal refer to the average AUC of 20× repeated fivefold stratified cross-validations. Values off the diagonal refer to the AUCs obtained by training the model on the profile of the corresponding row and applying it to the profile of the corresponding column. The LOCO row refers to the performances obtained by training the model on the 16 microbial biomarkers using all but the profile of the corresponding column and applying it to the profile of the corresponding column.
To externally validate the robustness and specificity of identified microbial biomarkers for the diagnosis of CRC, we introduced three independent test datasets, along with datasets of several non-CRC diseases, including inflammatory bowel disease (IBD), type 2 diabetes (T2D), and Parkinson’s disease (PD). The cross-validation models (Fig. 2a), cohort-to-cohort validations (Fig. 2b), and LOCO validations (Fig. 2c) with the test datasets consistently demonstrated favorable performance, collectively underscoring the resilience and robustness of the microbial biomarker panel. Meanwhile, a noticeable decline was observed in the non-CRC cases, when compared to CRC datasets. This observation supports the specificity of our biomarker panel for CRC, thereby ensuring its potential to yield a low false positive rate for CRC diagnosis in clinical practice. These critical characteristics align with the fundamental attributes expected for a biomarker, reinforcing the clinical utility of xMarkerFinder.
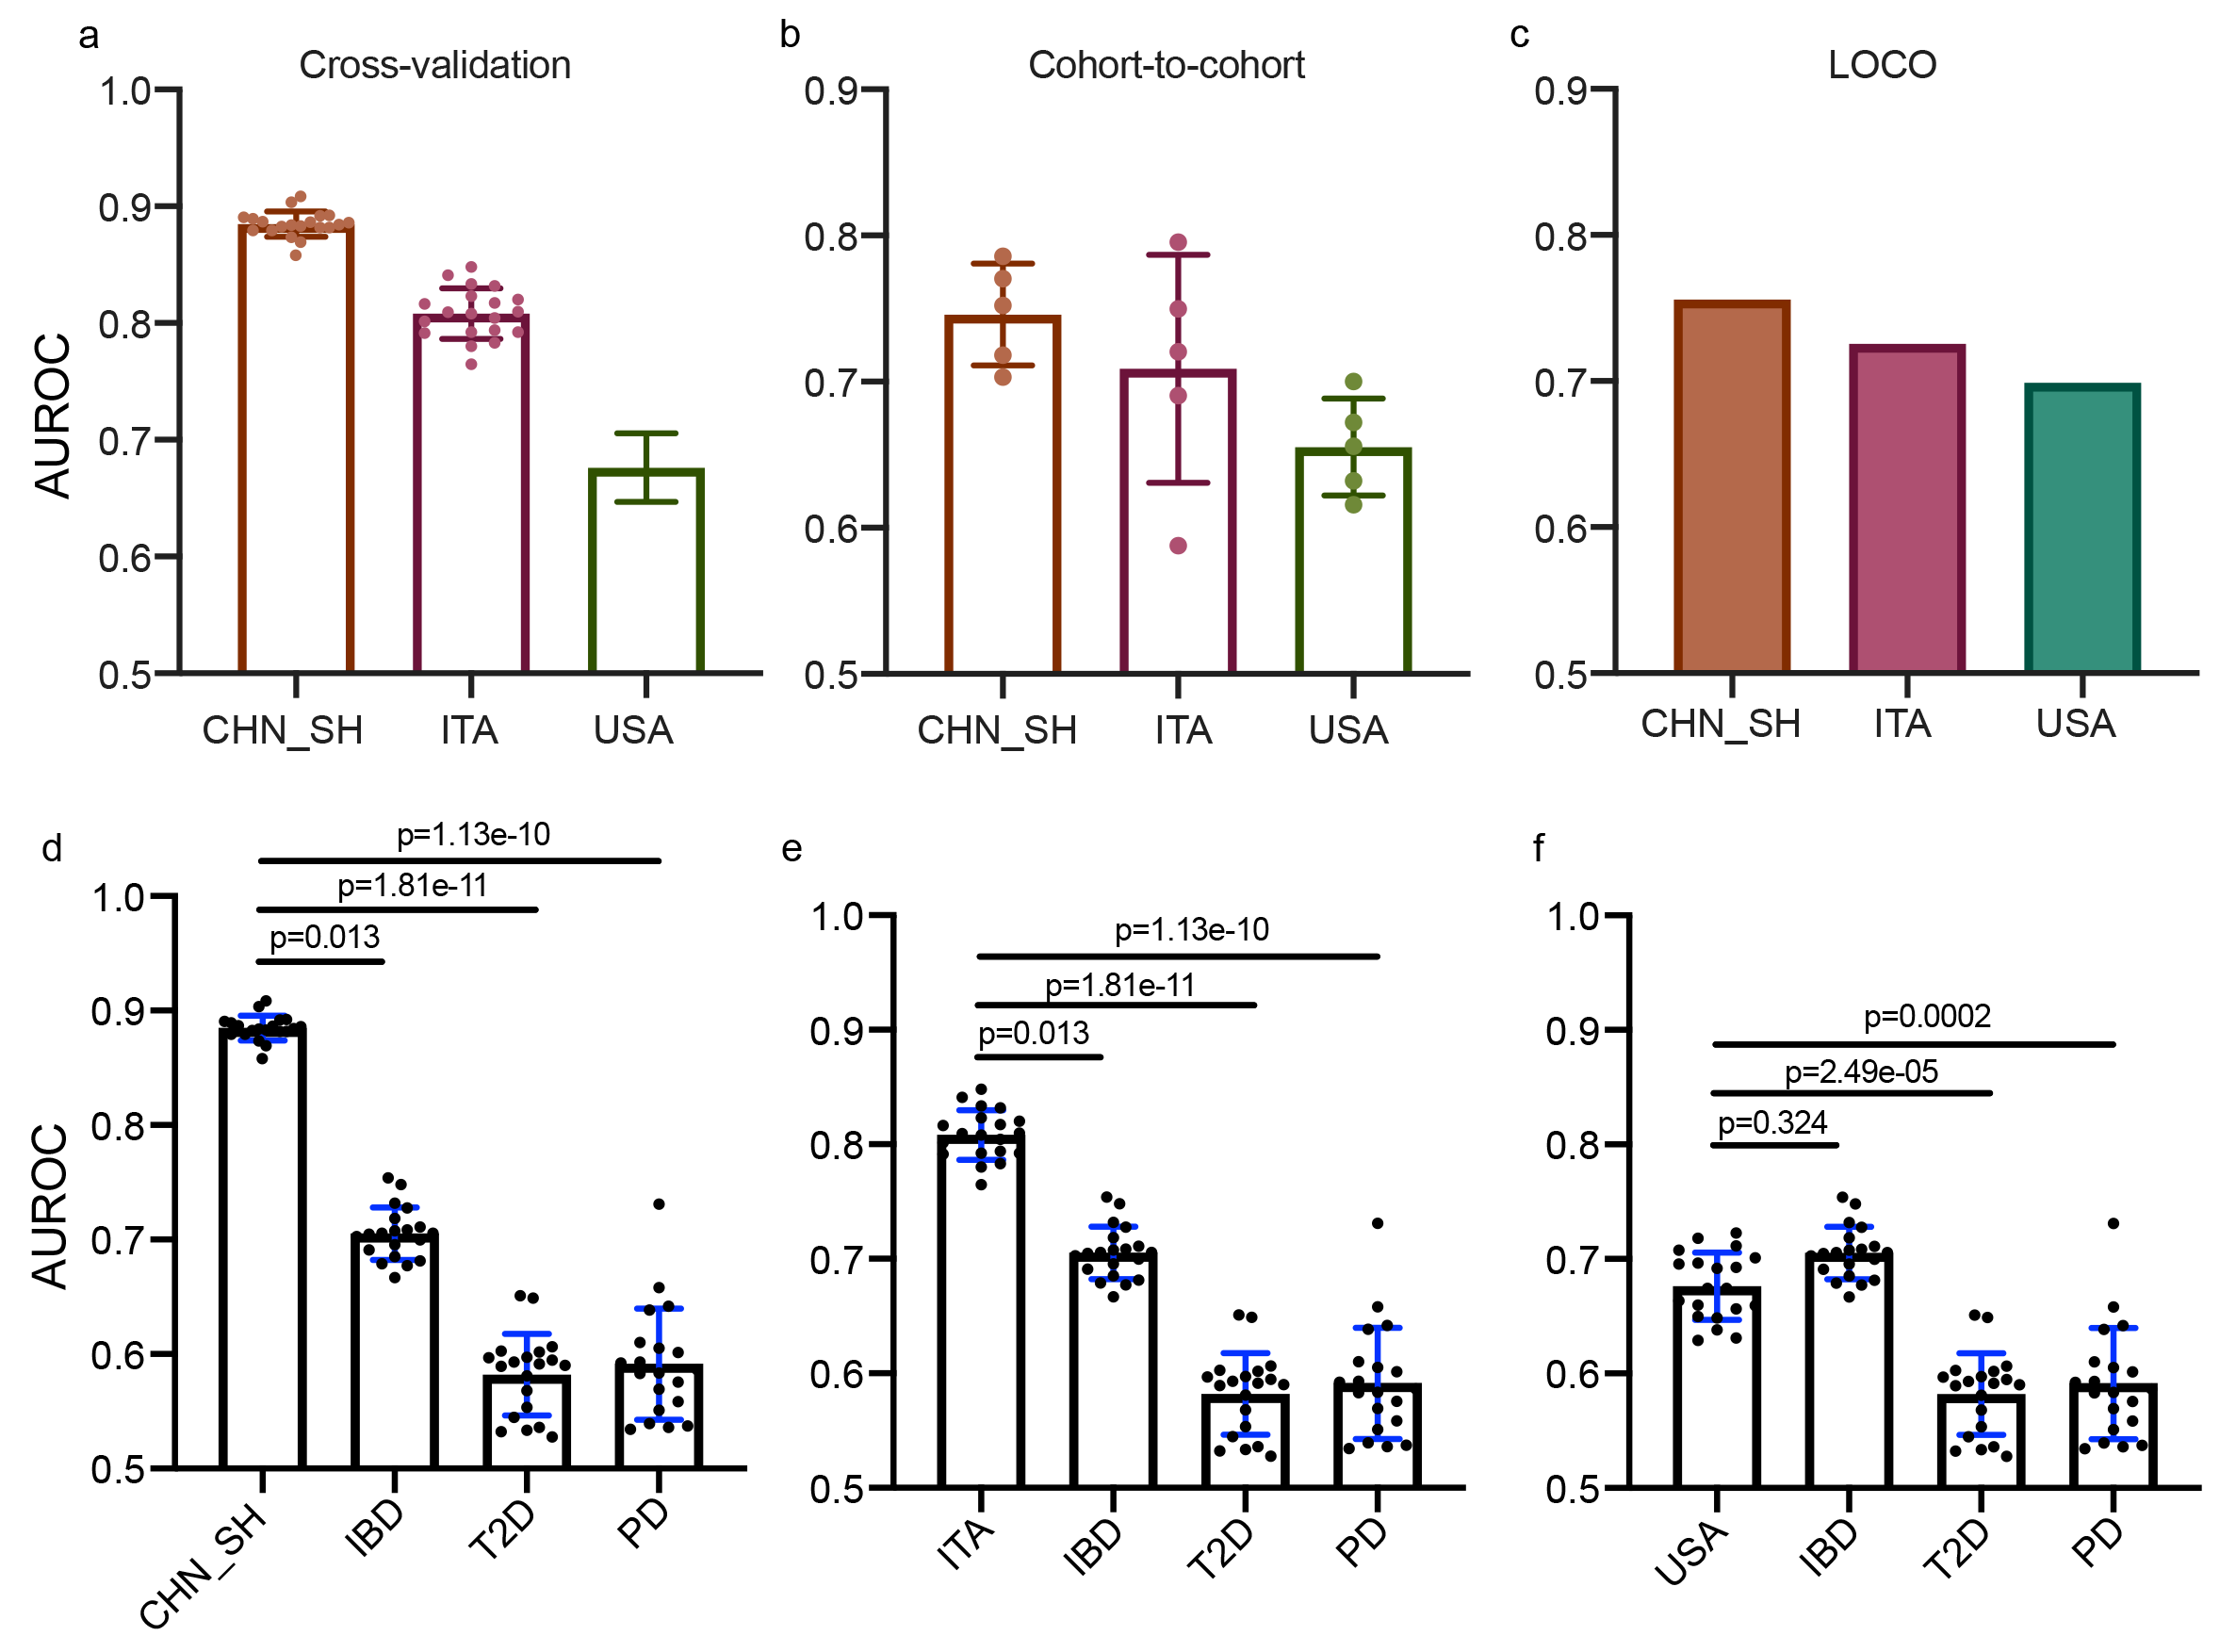
Fig.2 Validation of the microbial biomarkers for CRC diagnosis. The diagnostic accuracy based on the microbial biomarkers for test cohorts is indicated by the (a) cross-validation, (b) cohort-to-cohort, and (c) LOCO validations. The comparison of diagnostic accuracy based on CRC-associated microbial biomarkers in the independent test datasets (d, CHN_SH, e, ITA, f, USA) and non-CRC disease, including IBD, T2D, and PD.
Secondly, we used datasets from previous publications containing 16S rRNA gene sequencing data of the oral microbiome of patients with oral squamous cell carcinoma (OSCC) and controls. We applied xMarkerFinder to these oral microbiome datasets and successfully identified consistent microbial signatures associated with OCSS with great diagnostic capabilities(Fig. 3).
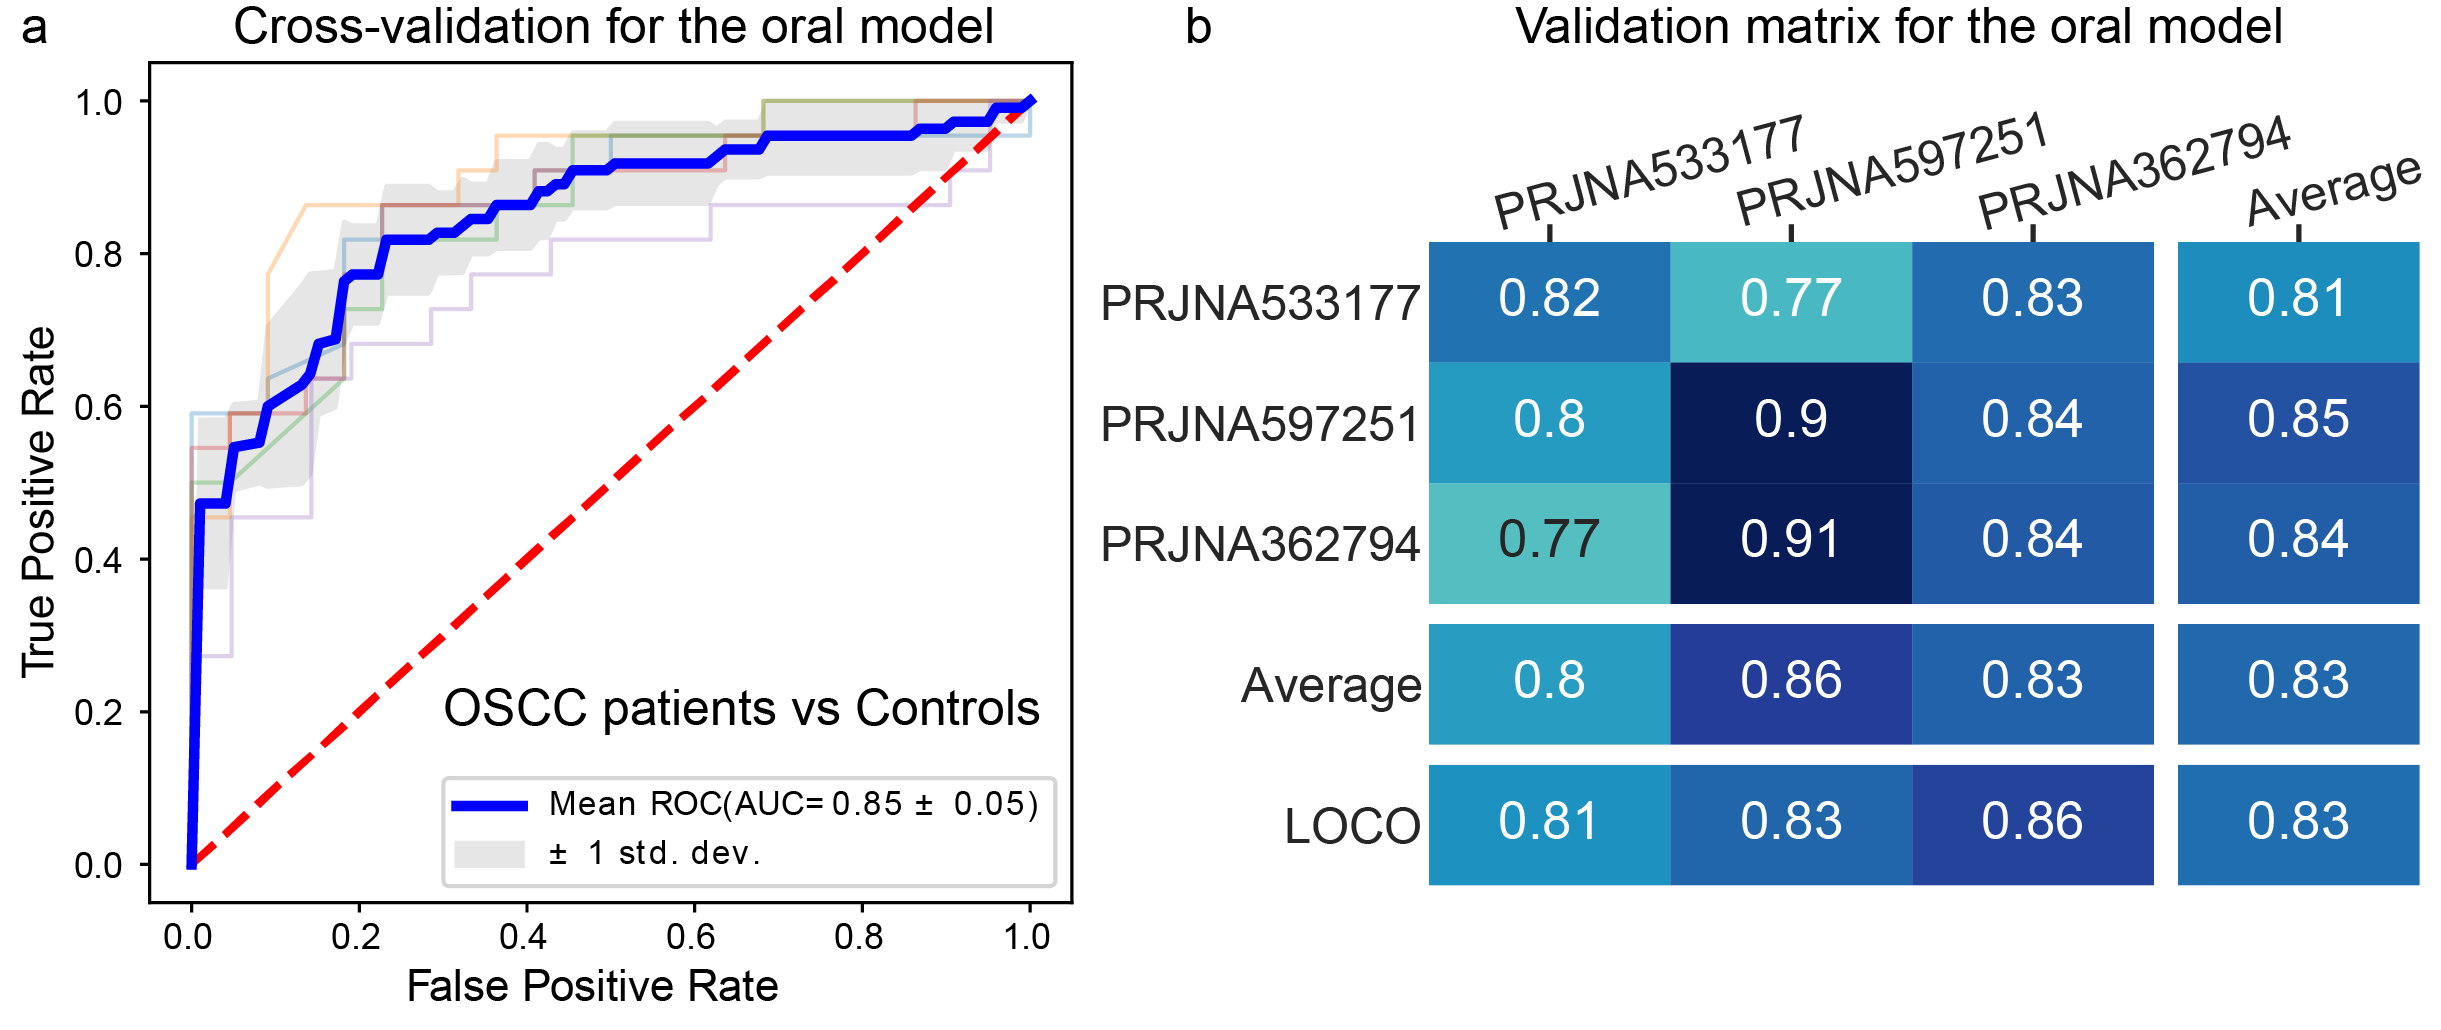
Fig.3 Application example of xMarkerFinder in human oral microbiome datasets. a , The AUC value of the classification model constructed with microbiome biomarkers derived from OSCC datasets. Mean AUC and standard deviation of stratified 5-fold cross-validation were shown. b, Cross-prediction AUC matrix of the classification model built with oral biomarkers. Values on the diagonal refer to the average AUC values of stratified five-fold cross-validation within profiles of each cohort. Off-diagonal values refer to the AUC values obtained by training the classifier on the profile of the corresponding row and applying it to the profile of the corresponding column. The LOCO row refers to the performances obtained by training the model using all but the profile of the corresponding column and applying it to the profile of the corresponding column.
Further, to demonstrate the generalizability of xMarkerFinder, we provide an additional example of its application in transcriptomic datasets of non-alcoholic steatohepatitis (NASH) patients. With three publicly available NASH cohorts, we utilized xMarkerFinder and the resulting classification model reached an impressive AUC value of 0.99, with the extraordinary capability to distinguish NASH patients from healthy controls. Meanwhile, the model demonstrated its robustness and applicability across various cohorts, highlighting its generalizability. (Fig. 4).
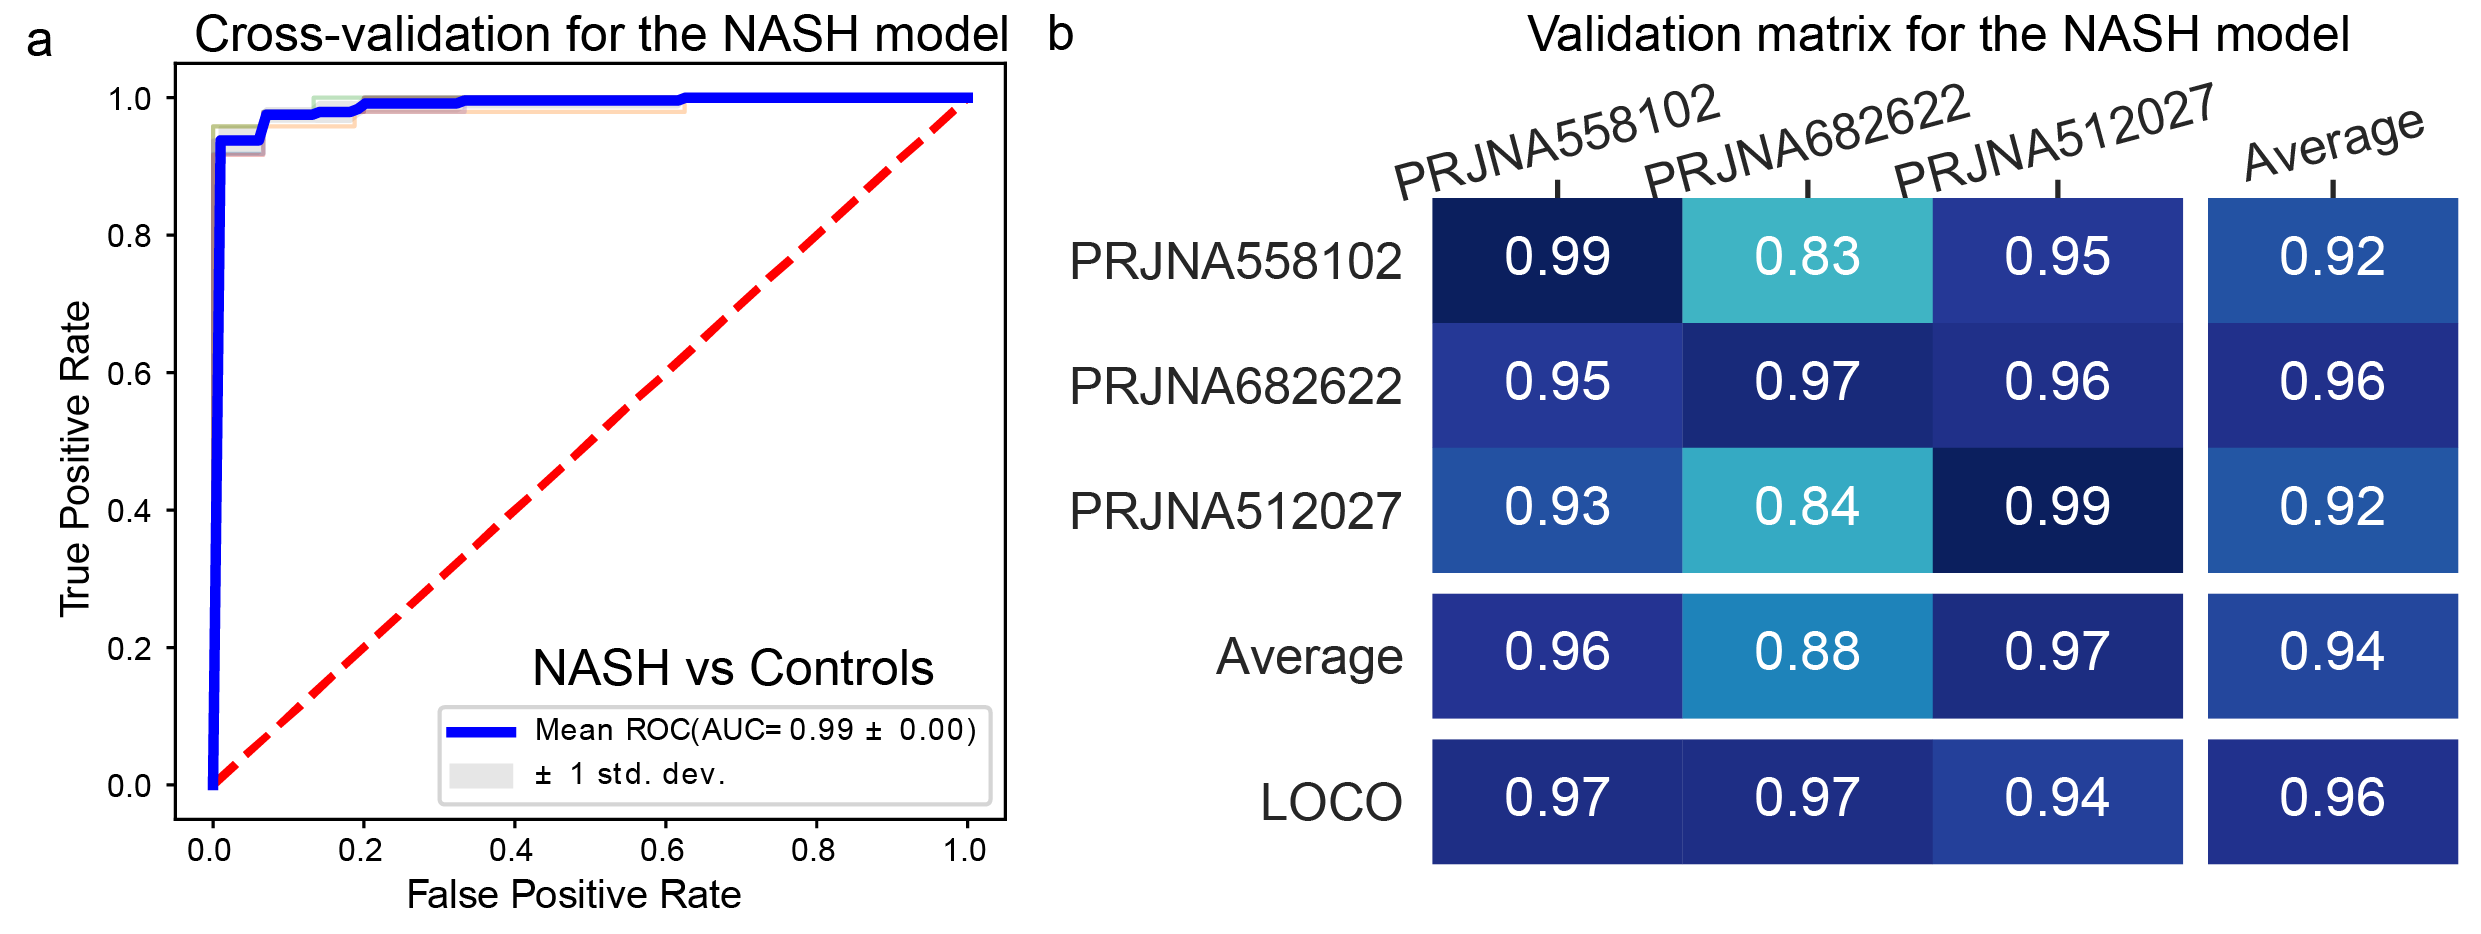
Fig.4 Application example of xMarkerFinder in NASH transcriptome datasets. a , The AUC value of the classification model constructed with transcriptome biomarkers derived from NASH datasets. Mean AUC and standard deviation of stratified 5-fold cross-validation were shown. b, Cross-prediction AUC matrix of the classification model built with NASH biomarkers. Values on the diagonal refer to the average AUC values of stratified five-fold cross-validation within profiles of each cohort. Off-diagonal values refer to the AUC values obtained by training the classifier on the profile of the corresponding row and applying it to the profile of the corresponding column. The LOCO row refers to the performances obtained by training the model using all but the profile of the corresponding column and applying it to the profile of the corresponding column.
Lastly, we delved into the rich metagenomic datasets sourced from the renowned Tara Ocean project. Through this exploration, we were able to elucidate the distinctive microbiota present within the vast expanse of the oceanic environment, pinpointing specific microbial communities that differentiate between the deeper ocean regions and those near the surface, as illustrated in (Fig.5). These observations from the Tara Ocean project serve as compelling evidence of the broad and diverse range of applications that xMarkerFinder offers. This breadth of applicability is testament to the tool's versatility and potential in a myriad of scientific contexts.
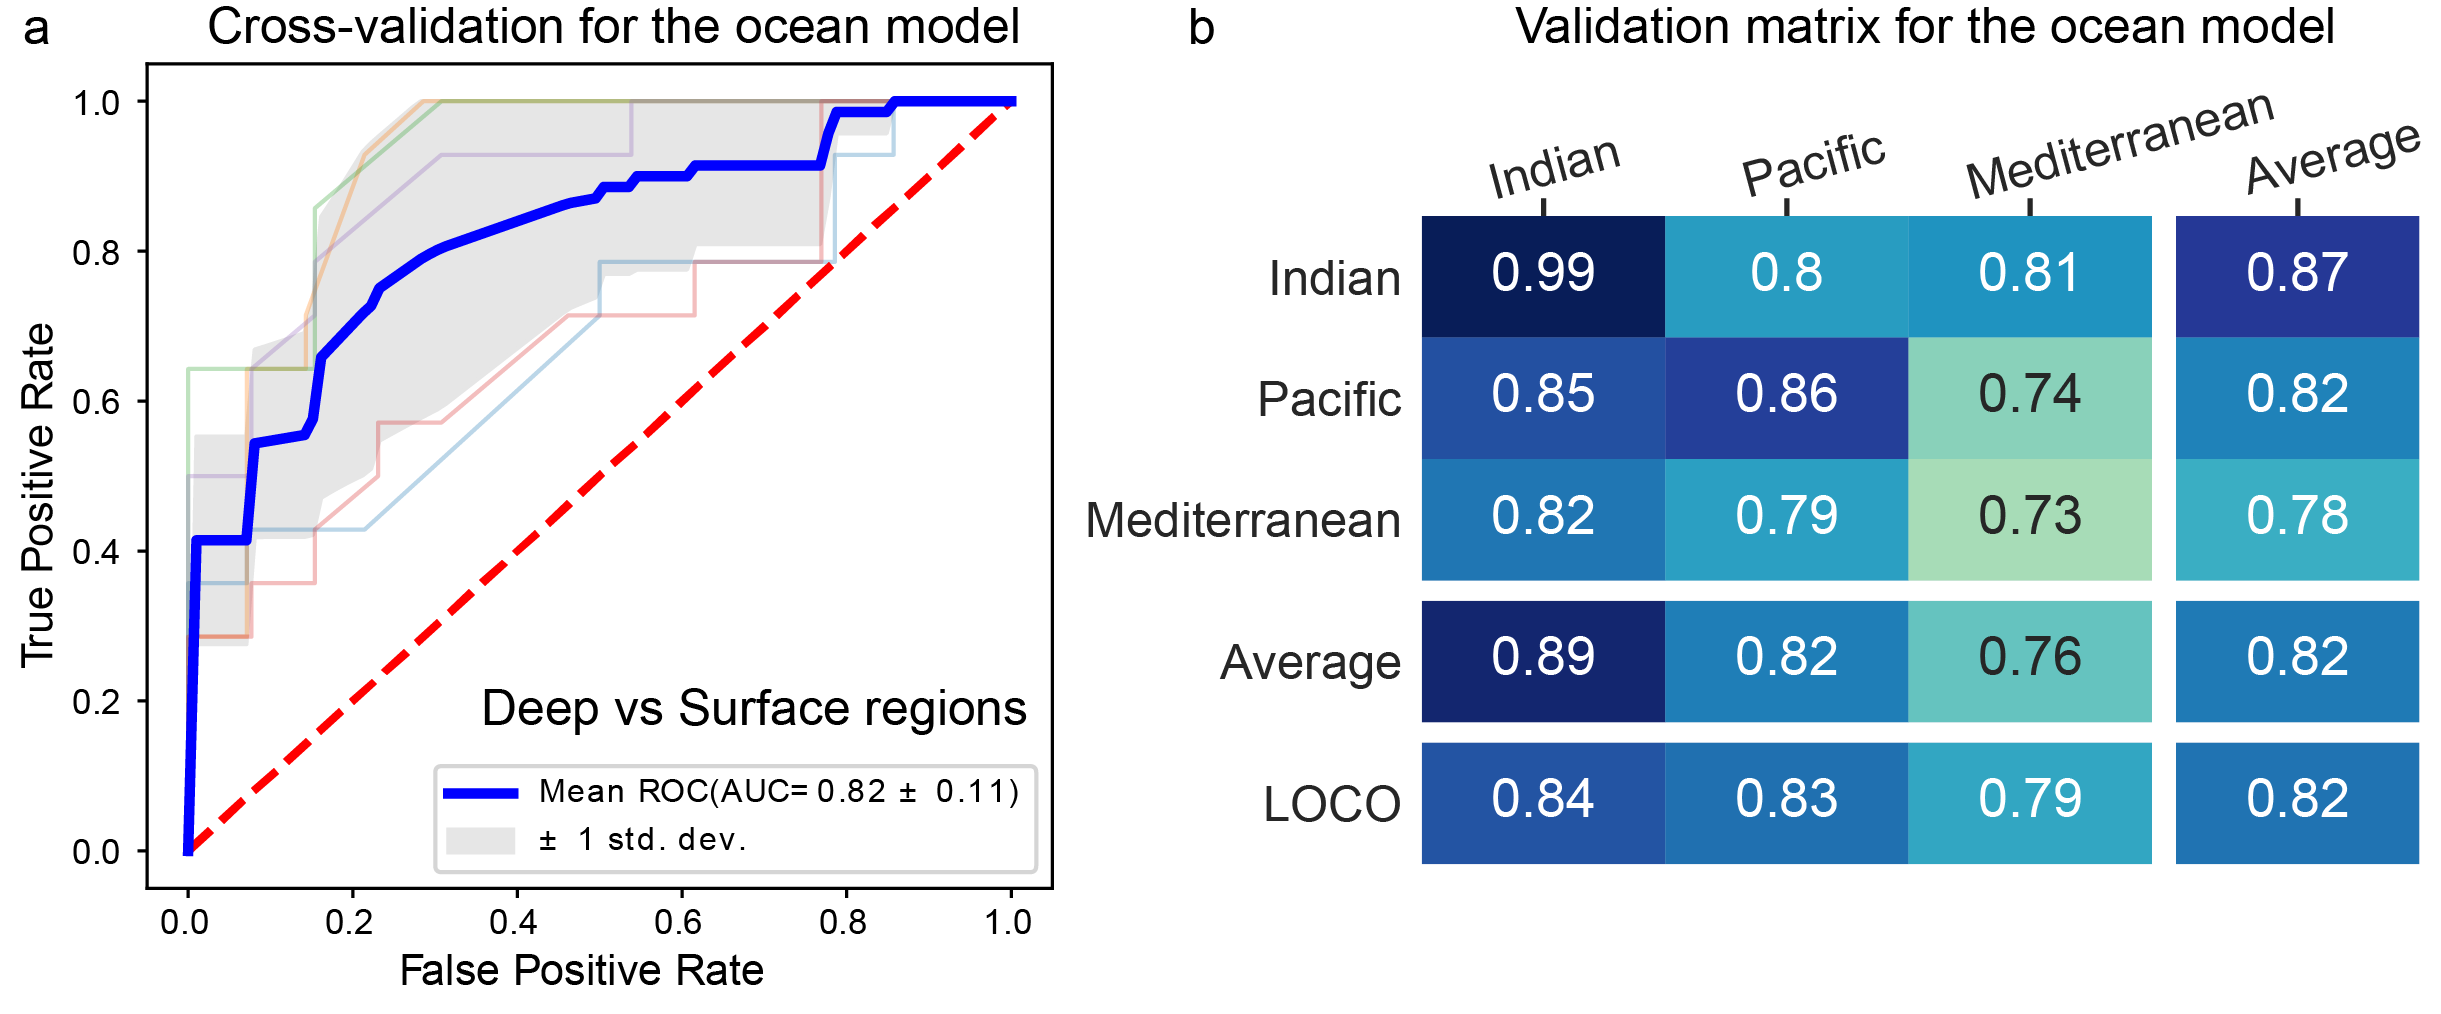
Fig.5 Application examples of xMarkerFinder in ocean microbiome datasets. a, The AUC (area under the ROC curve) values of the classification model constructed with microbial biomarkers derived from Tara Ocean microbiome. Mean AUC and standard deviation of stratified 5-fold cross-validation were shown. b, Cross-prediction AUC matrix of the classification model built with ocean biomarkers. Values on the diagonal refer to the average AUC values of stratified five-fold cross-validation within profiles of each cohort. Off-diagonal values refer to the AUC values obtained by training the classifier on the profile of the corresponding row and applying it to the profile of the corresponding column. The LOCO row refers to the performances obtained by training the model using all but the profile of the corresponding column and applying it to the profile of the corresponding column.