User Guide
The Design of this User Guide
KGCoV is a knowledge graph of COVID-19 that integrates epidemiological data and virus genomic data to find the evolution trends of reconstruct infection paths of COVID-19.
This User Guide is designed to be a practical, plain language guide for the beginner or for anyone who wants to use KGCoV.
Each major section in this User Guide represents one of the pages in the KGCoV in which you will find a summary of purpose for the KGCoV page and step-by-step instructions for the more detailed function. These instructions include screen shoots to help you associate the instructions in this guide with the KGCoV page.
HOME Page
The Home page contains the search tool, schema, important data statistics, and a project overview of KGCoV. From the Home page, users can learn about the main purpose of the KGCoV project and the amount and structure of the data.
Users can search the data in the database by using search tool. For example:
- Variant: 14408, ORF1ab
- Genome: EPI_ISL_407987, hCoV-19/Singapore/2/2020
- Event: Diamond Princess, Brazil's first case
- Symptoms: fever, myalgia, headache
- Location: Indian, USA
Genome-Case Page
1. Advance Search
Enter the Genome-case page, first set the search conditions. Without setting any search conditions, all genomes of matching cases will be searched by default. The logical relationship of all the filter conditions is AND.
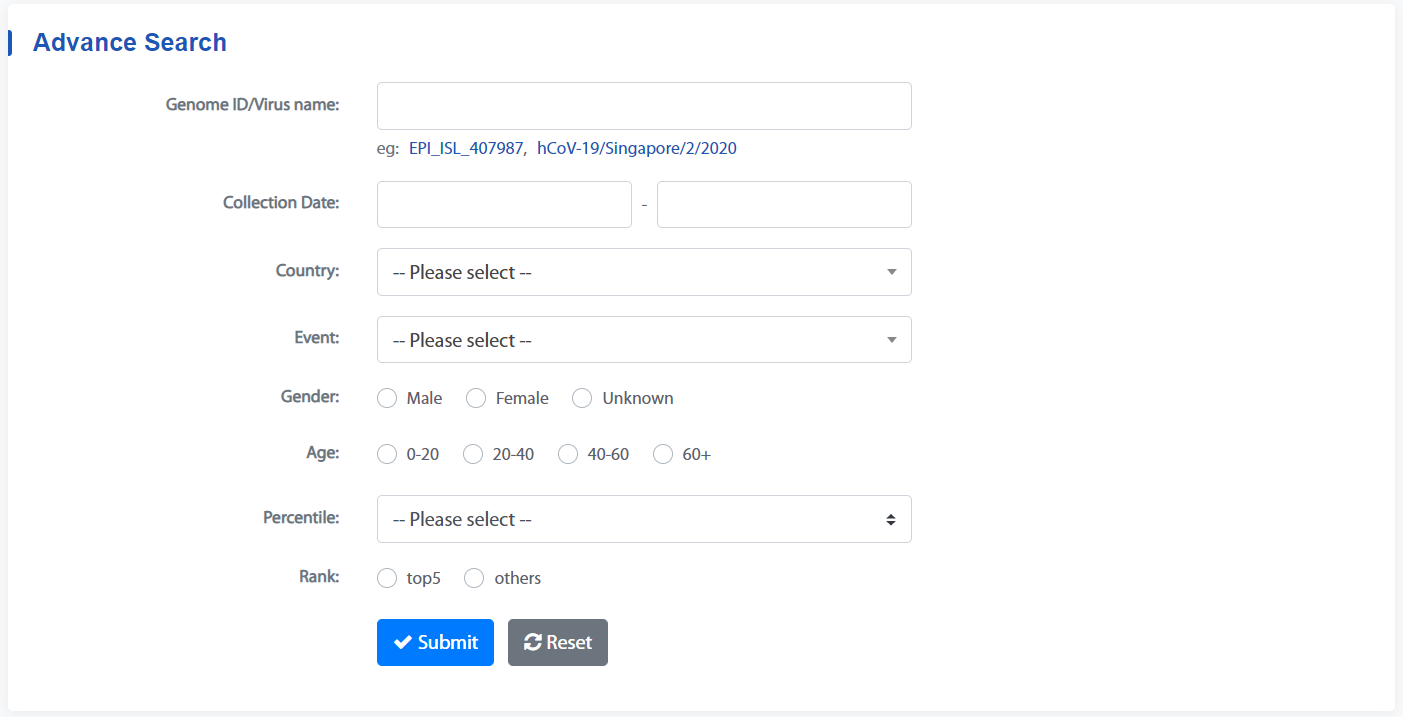
Submit the filter to get results.
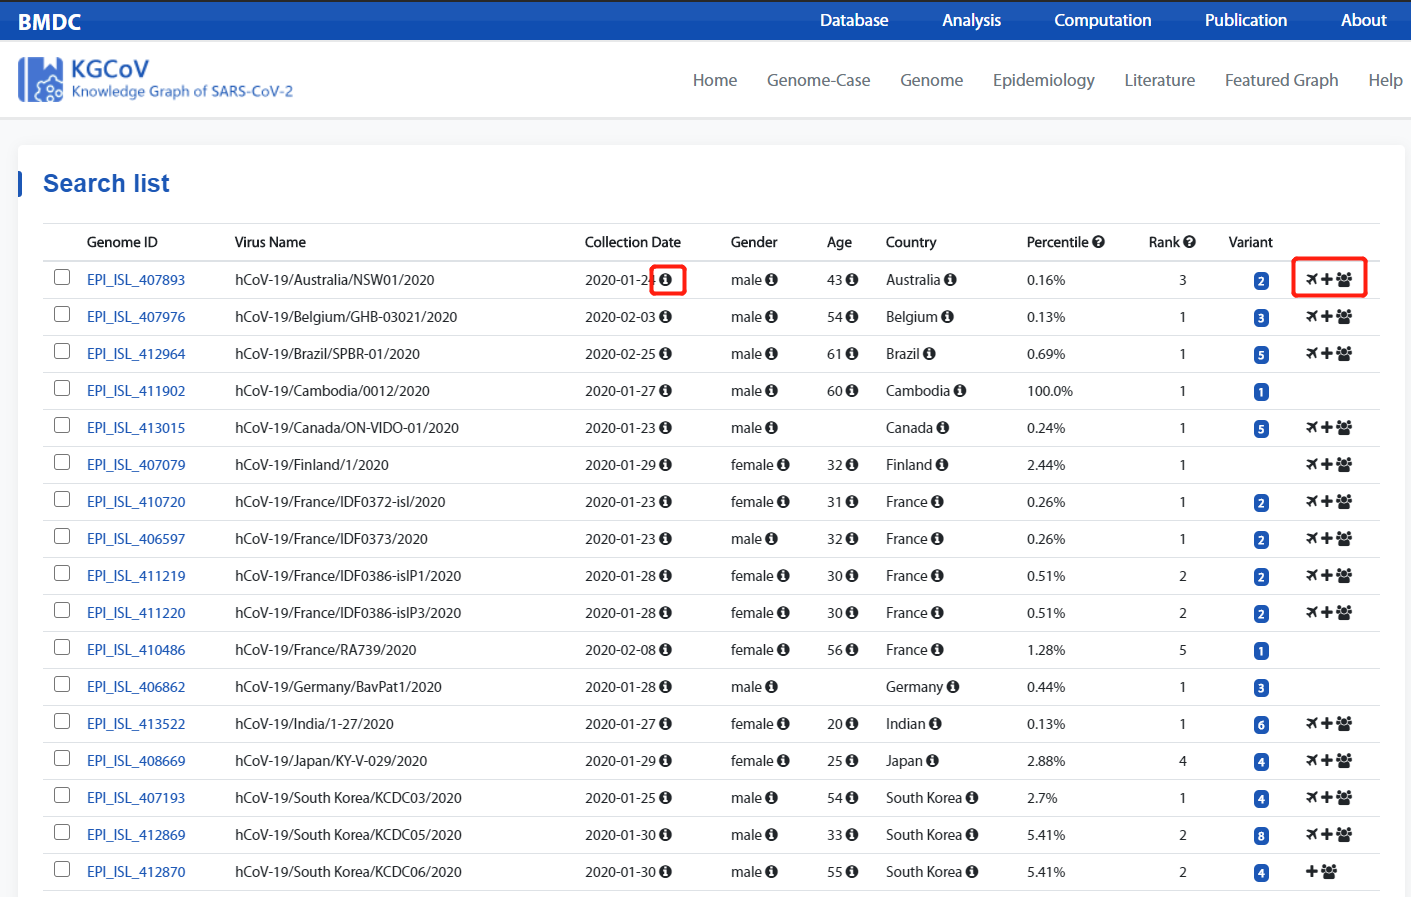
- Indicates that the data is quality-controlled and different from the metadata..
- These three ICONS represent: Travel Info, Clinical Info, Contact Info. The corresponding icon appears to indicate that there has corresponding information.
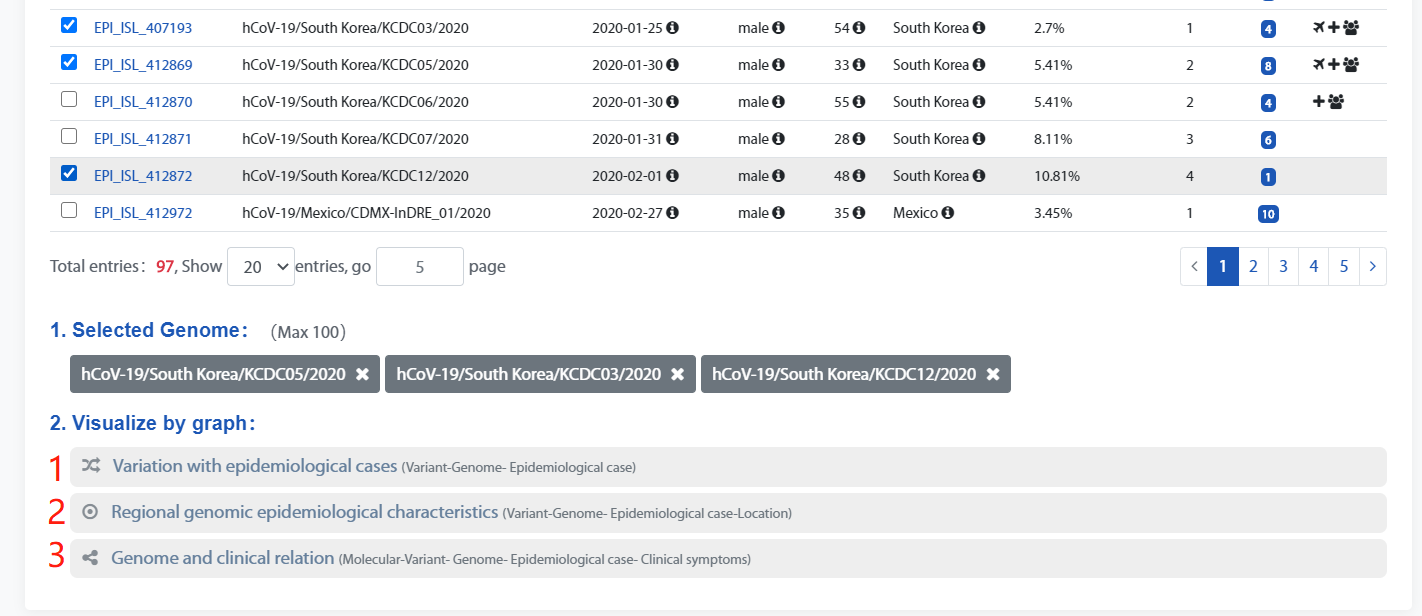
2. Draw knowledge graph
Select the genome as needed which will be displayed in Selected Genome below.
There are three options for Click Type that can draw different types of knowledge graph according to the checked genomes.
Type 1: Variation with epidemiological cases. Mainly shows the genomic variation and its epidemiological information.
Type 2: Regional genomic epidemiological characteristics. Mainly shows the genome and its epidemiological information within a region.
Type 3: Genome and clinical relation. Mainly shows the genomic variations and patient's clinical symptoms.
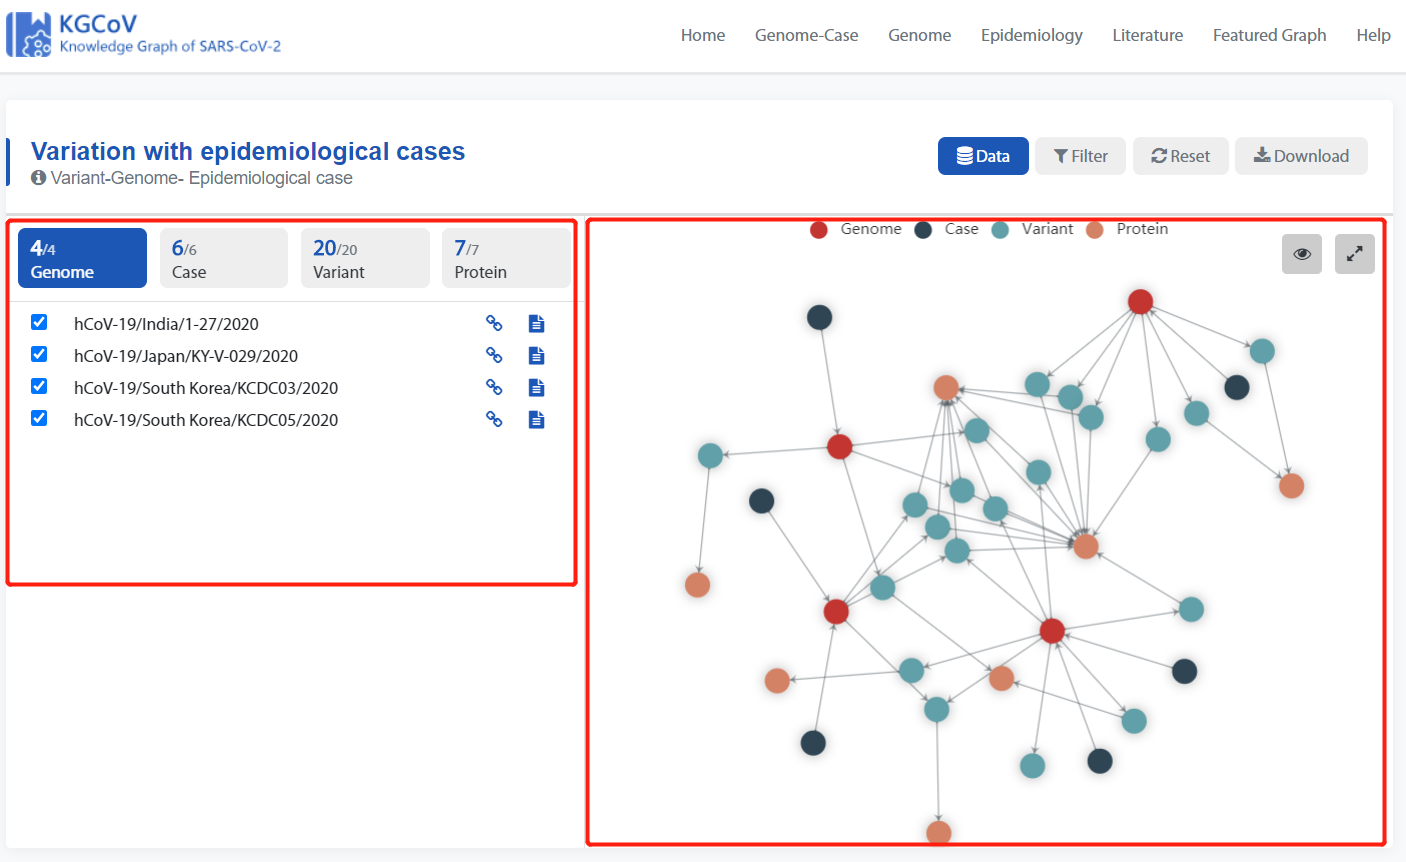
Knowledge graph page composition
- Display of detailed information is on the left, and display of the knowledge graph is on the right.
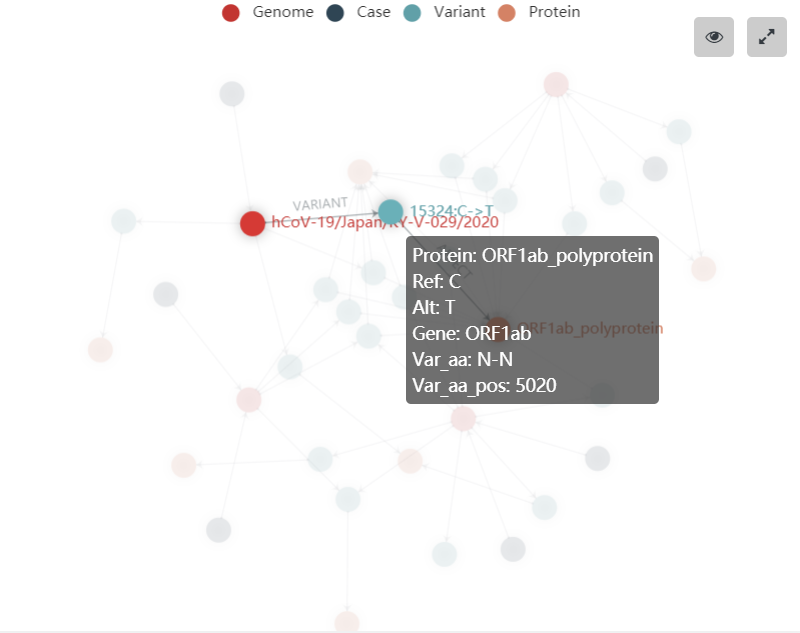
- Hover over the knowledge graph to display more information.
- Click the to display the knowledge graph webpage in full screen.
- Click the to restore the original page.
- Click the to hide or display text.
- Click the filter button to filter the data.
-
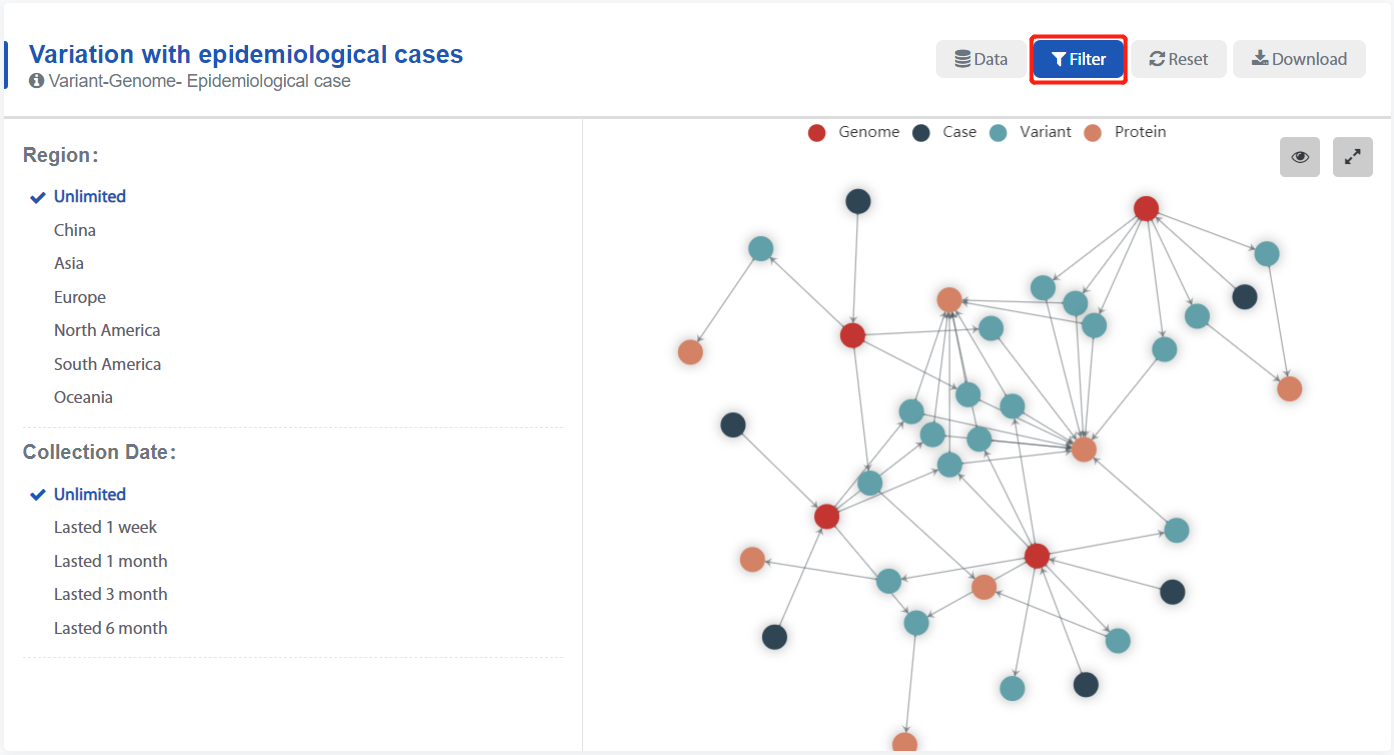
- Click the Reset button to clear the filter.
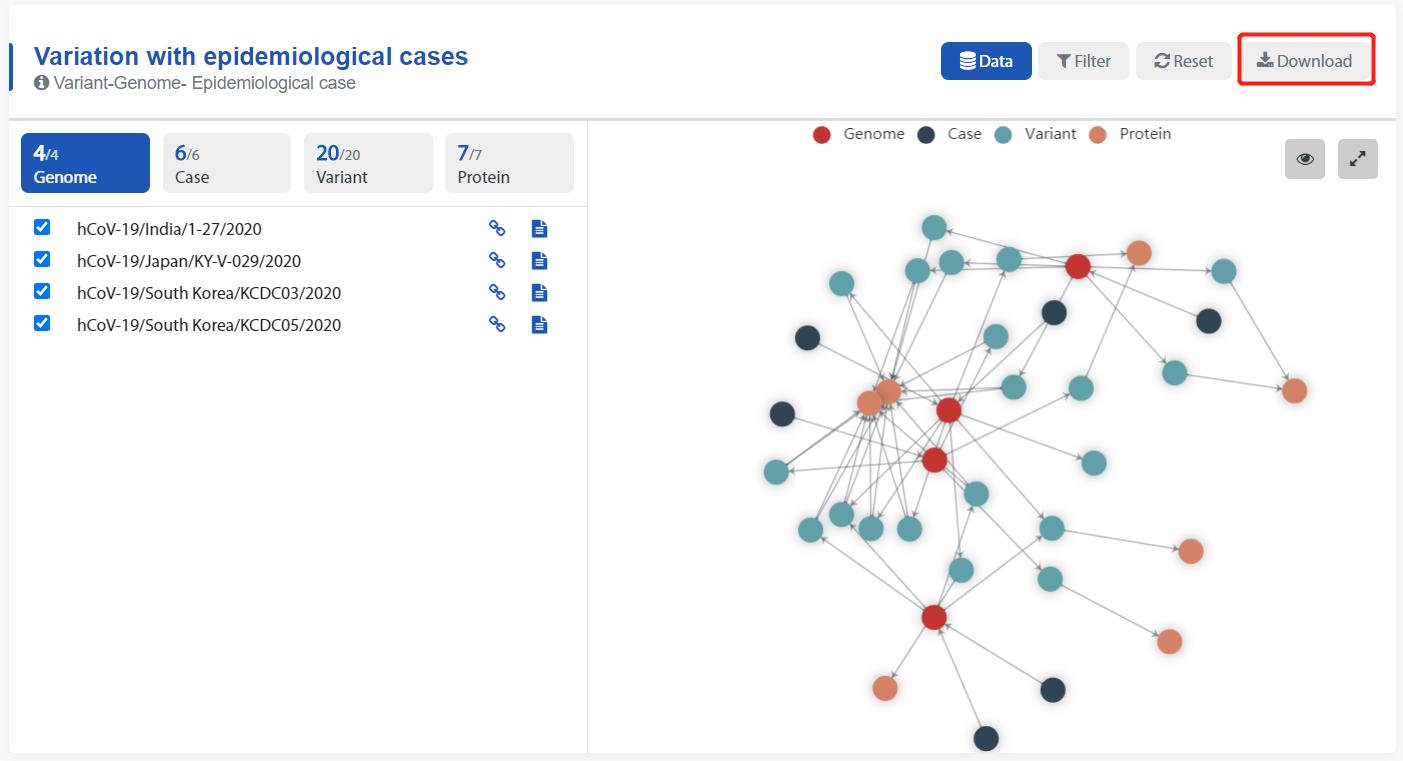
- Click the Download button to download the data.


Genome Page
Genome page consists of two main parts: 1.Genome display list, 2. Filter box.
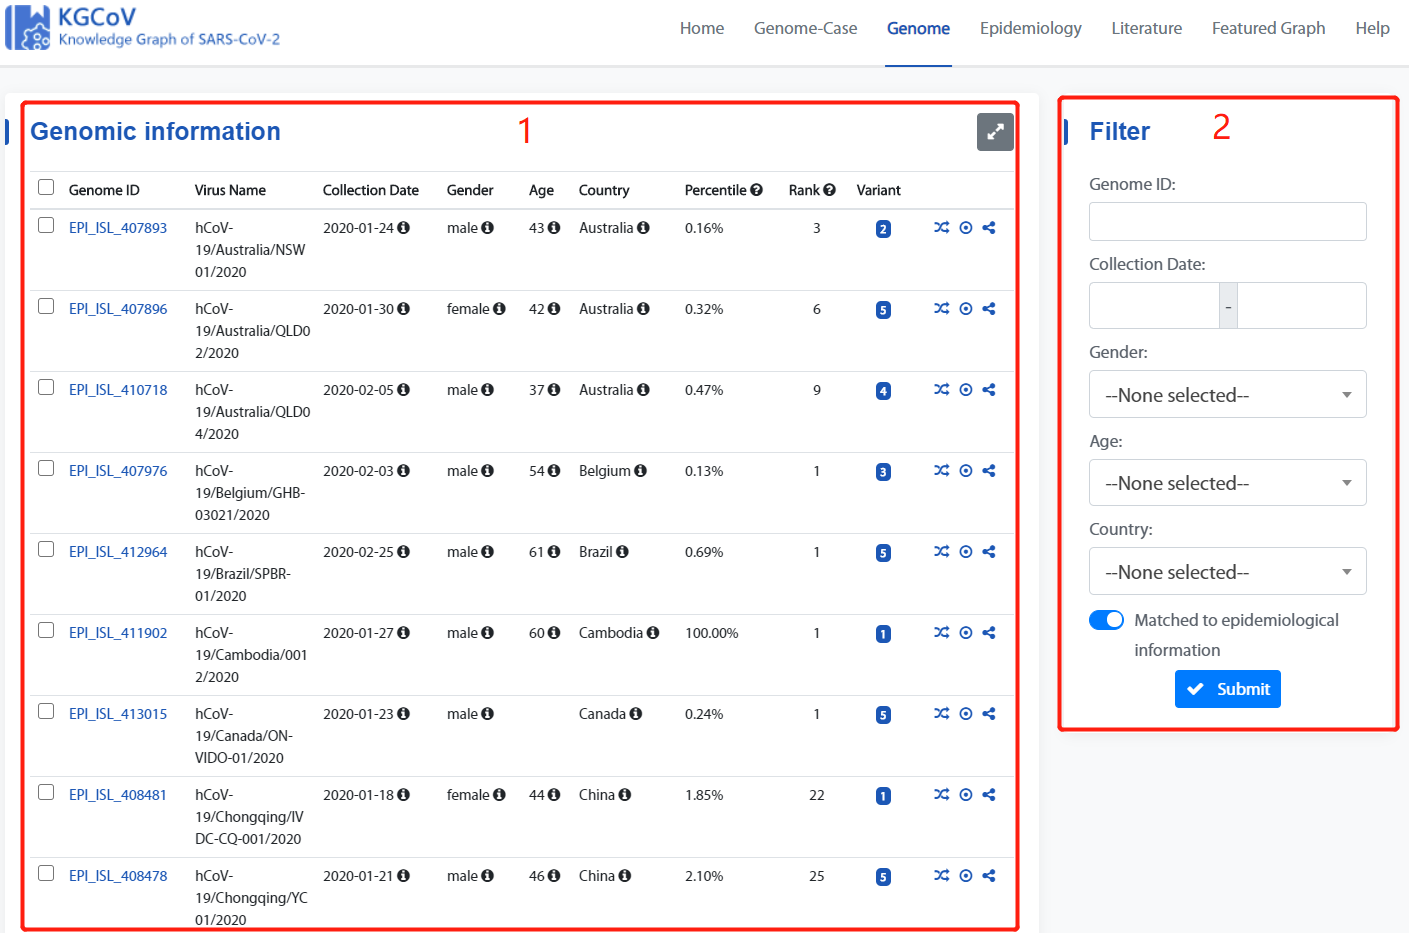
1. Genome display list
- The genome list, support check, click the download button to download the checked data.
- Click the to display the table in full screen.
- Prompt for the tag to get the description of corresponding field.
- Indicates that the data is quality-controlled and different from the metadata.
- The icons 1, 2, and 3 represent the three types of knowledge graph respectively. Whichever icon appears indicates that the genome has a corresponding type of knowledge graph.
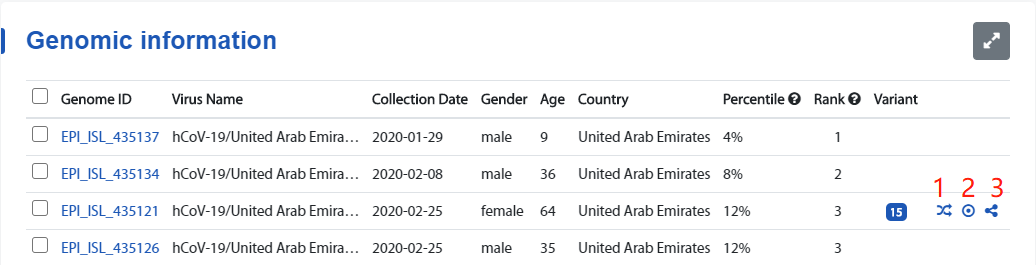
- 1 : Variation with Epidemiological cases, mainly shows the genomic variation and its epidemiological information.
- 2 : Regional genomic epidemiological characteristics, mainly shows the genome and its epidemiological information within a region.
- 3 : Genomic and clinical relation, mainly shows the genomic variations and patient's clinical symptoms.
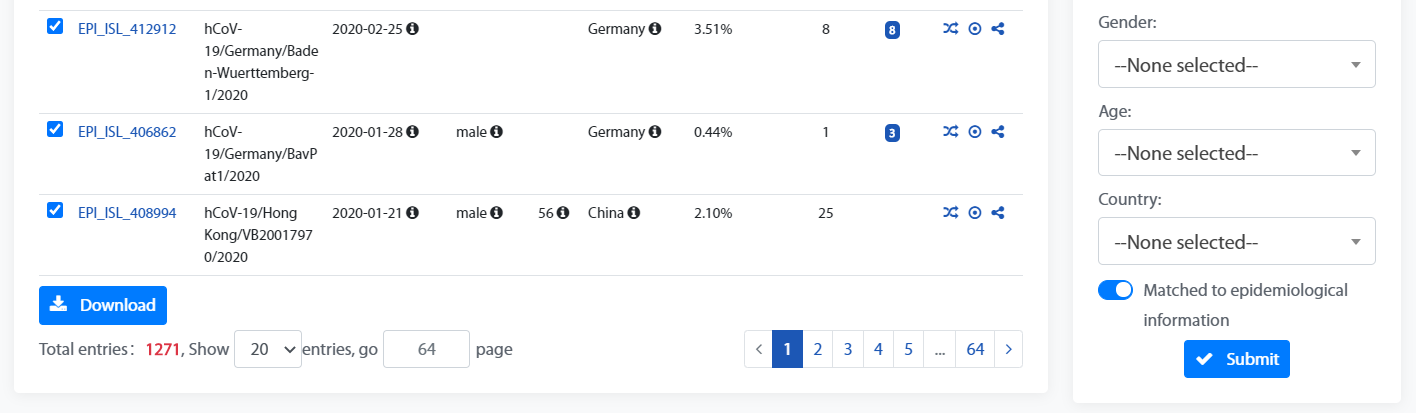
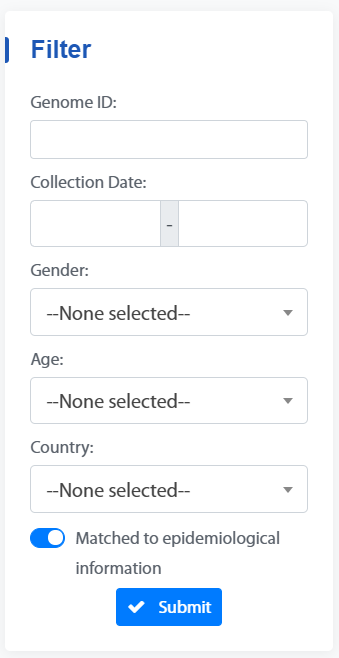
2. Filter box
The Filter box can be used to filter genomes by “Genome ID”, “Collection Date”, “Gender”, “Age”, “Country” and “Matched to epidemiological information”.
Epidemiology Page
Epidemiology page consists of two main parts: 1.Case display list, 2. Filter box.
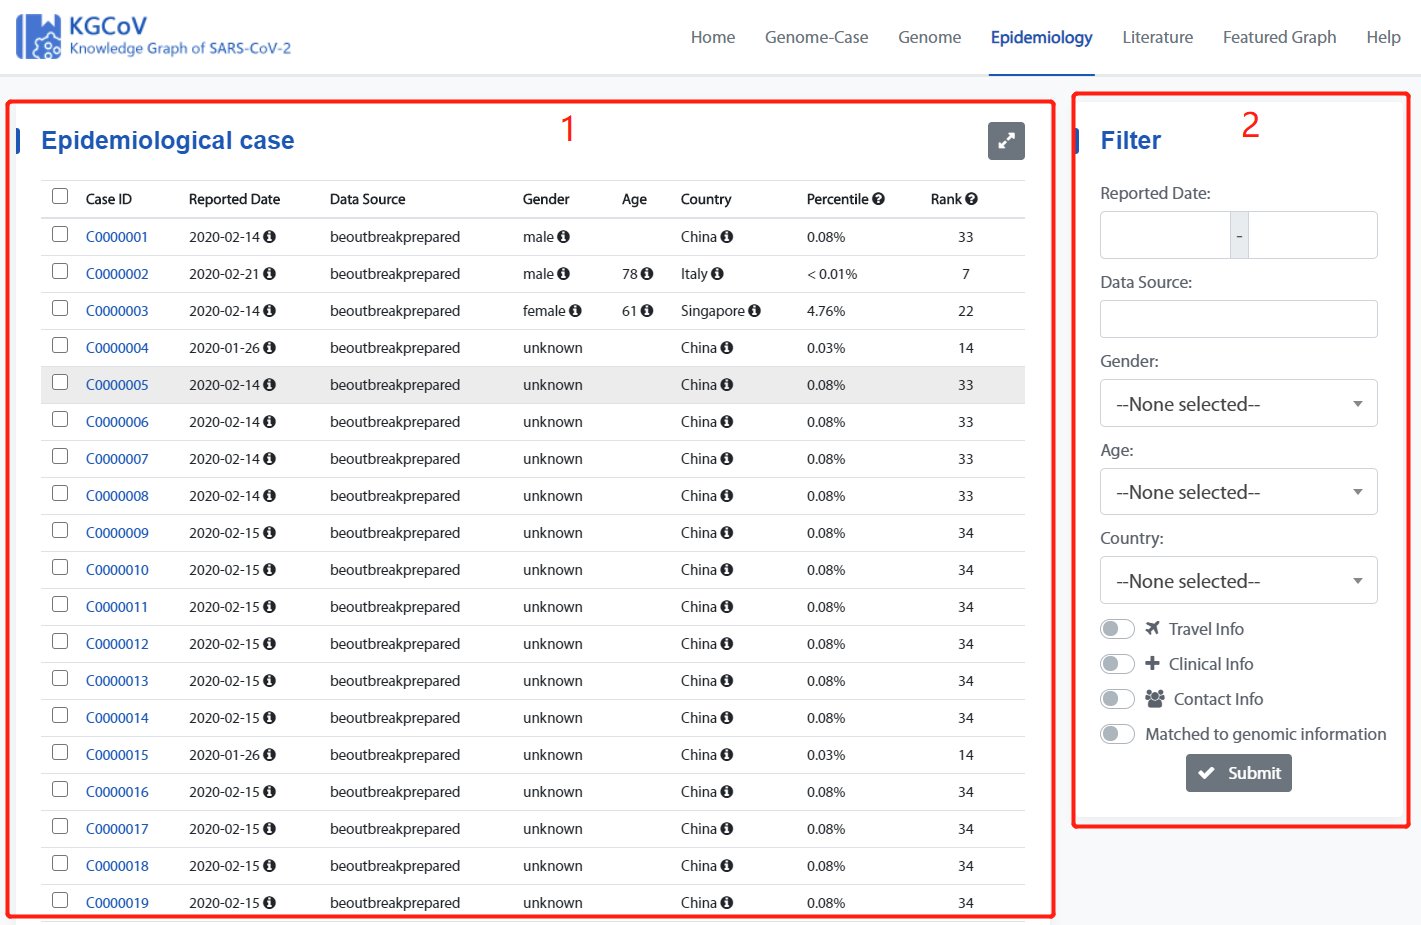
1. Case display list
Similar to the previous section, see
2. Filter box
The Filter box can be used to filter genomes by “Reported Date”, “Data Source”, “Gender”, “Age”, “Country”, “Travel Info”, “Clinical Info”, “Contact Info”, “Matched to genomic information”.
Check “Travel Info”, “Clinical Info” and “Contact Info” to represent the case that screens the information of “Travel Info”, “Clinical Info” and “Contact Info”.

Check “Matched to genomic information” select case with the matched genome.

Literature Page
Literature page consists of two main parts:
1. Basic information of the article.
2. The genomic information presented in the article.
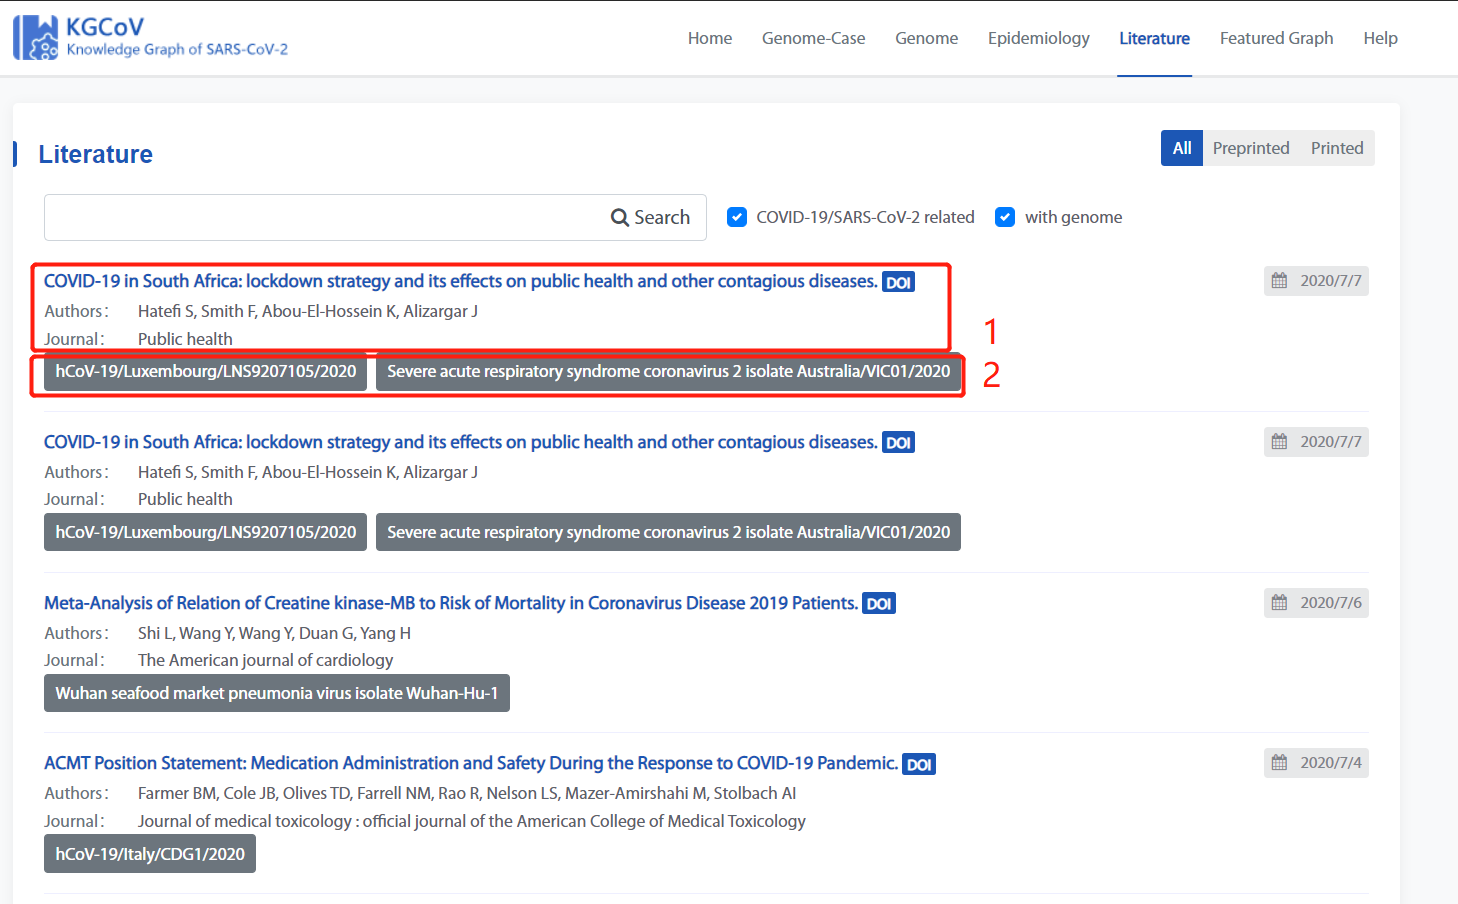
1. Basic information of the article

Check “COVID-19/ SARS-COV-2 related” to see the literature related to COVID-19.

Check “with genome” to see the literature with genome.

Filter the literature according to the publication status of the article.

Show the time the article submitted to the database.
Featured Graph Page
Featured Graph Page shows the manual curated COVID-19 transmission events.
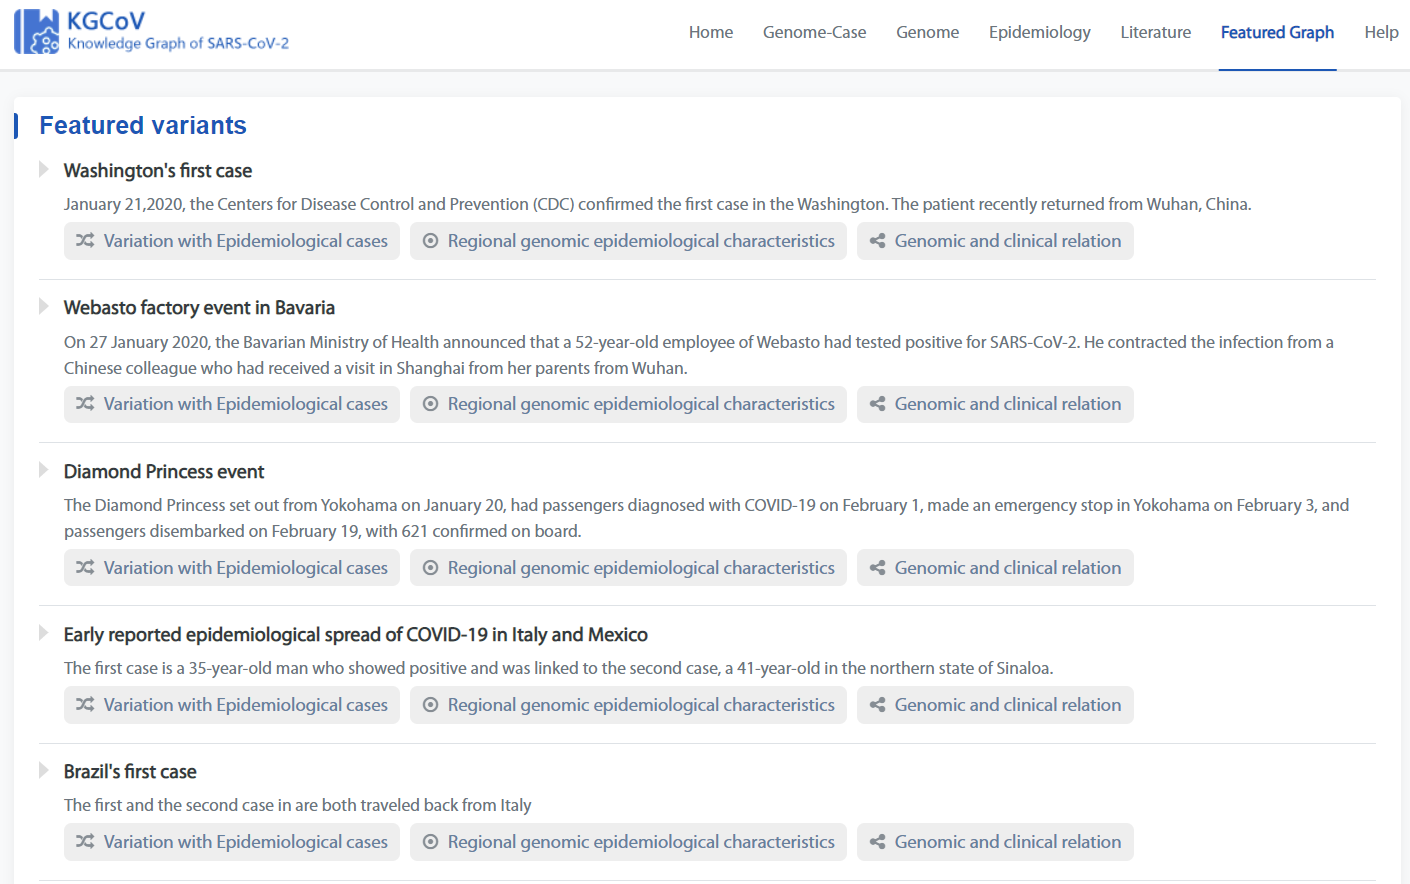
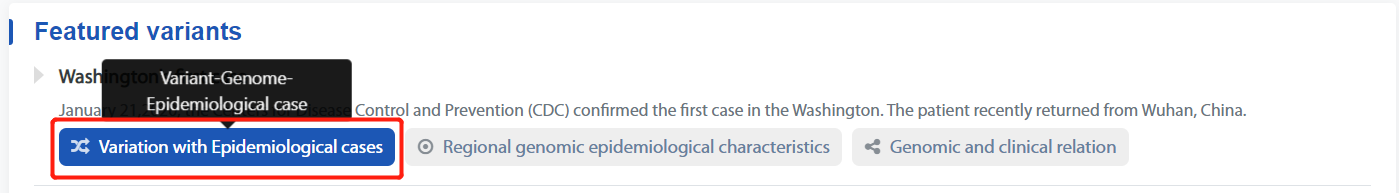
The three buttons under each event link to the corresponding type of knowledge graph.
eg. Click the following icon to jump to the Type1 knowledge graph of “Washington's first case”.
Type1 knowledge graph of “Washington's first case”:
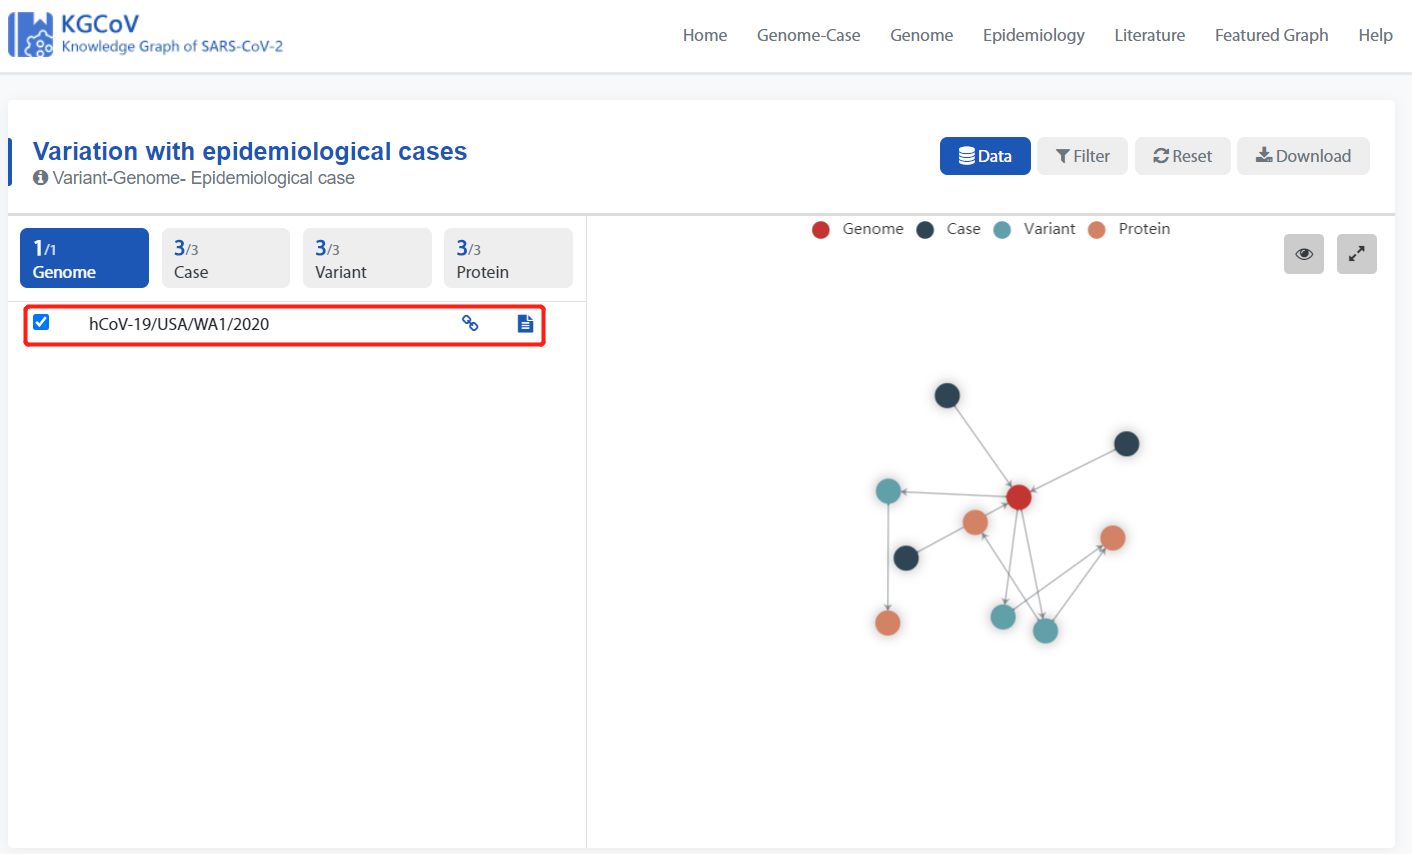
The genome in the red box represents the genome associated with the “Washington's first case”
Help Page
Help page is composed of 4 parts: 1.Data Sourses,2.Data Model,3. FAQ,4.User Guide.
Download
Our data can be downloaded in the following ways.
1. Knowledge graph data Download
All knowledge graph data can be downloaded in JSON format by clicking the button above,
2. Table data Download
All table data can be downloaded in XLS format by clicking the button below,