Help
Results interpretation
The results page contains three zones:
-
Antigenic zone: The results are presented in both antigenicity clustering tree and heatmap. The figure can be interactively zoomed and manipulated.
-
Downloading zone: The detailed antigenic similarity matrix can be downloaded for queried epitope against representative S variants and benchmarking S proteins.
-
Strain statistic zone: The statistics of cumulative strains and monthly circulating strains is shown for each queried ID since the emergence.
1) Antigenicity results of the queried variant.
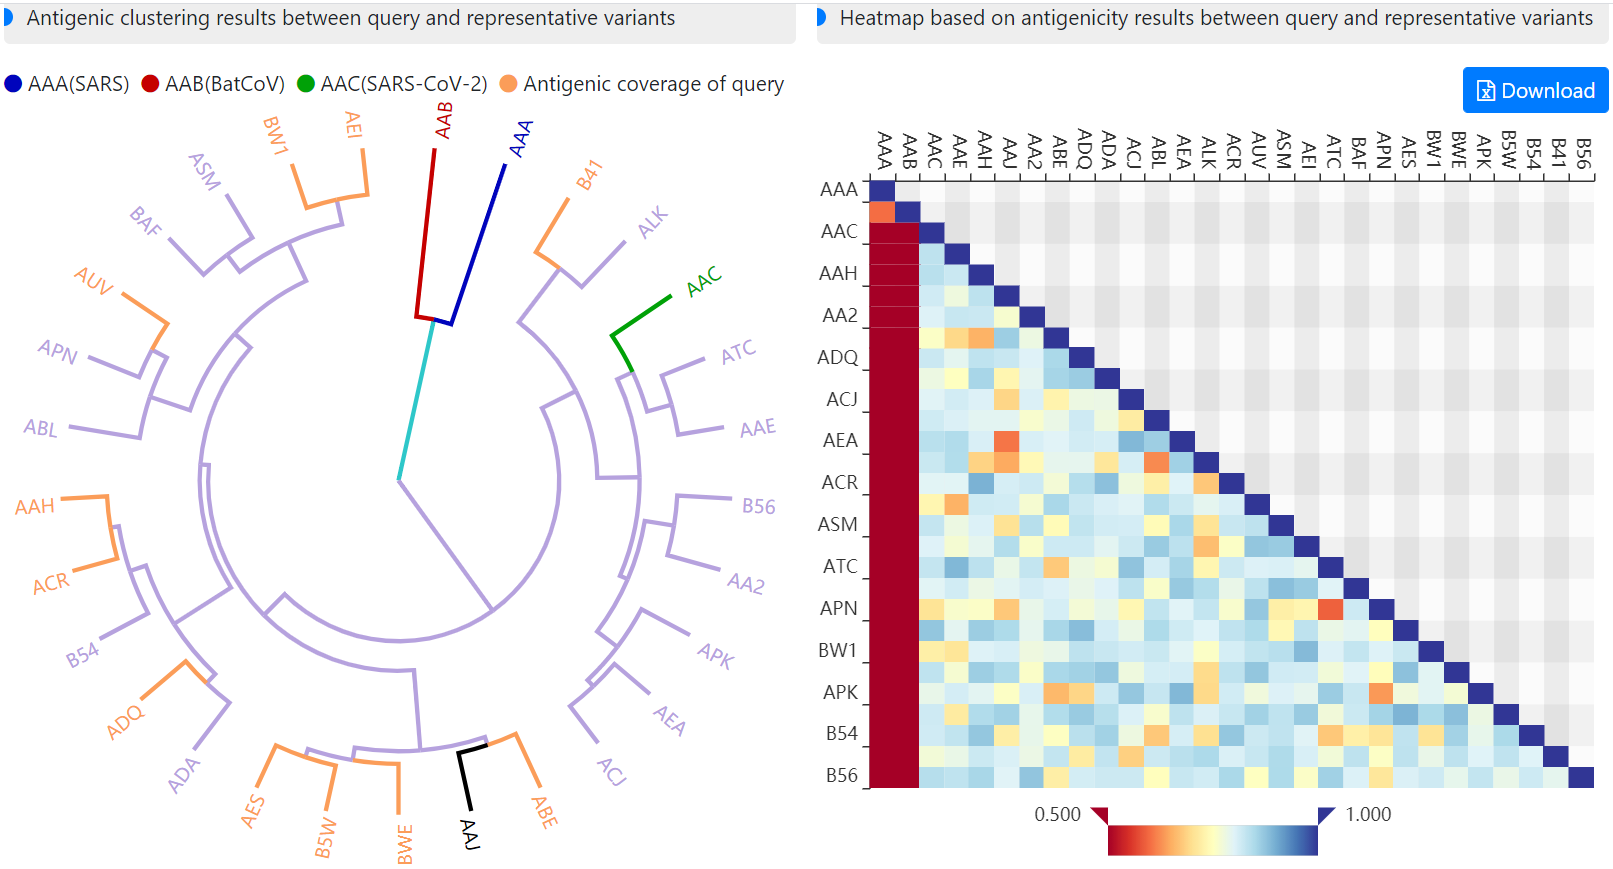
The three benchmarking S antigens were colored in blue (AAA), red (AAB)
and green
(AAC). The antigenic coverage represented by antigenic similar S variants were painted
in orange for clustering tree and in blue for heatmap, respectively. The antigenic
coverage is calculated based on the defaulted cutoff (0.8) of antigenic similarity, more
detailed antigenic similarity score matrix can be downloaded by clicking the “Download”.
2) Strain statistics of the queried variant.
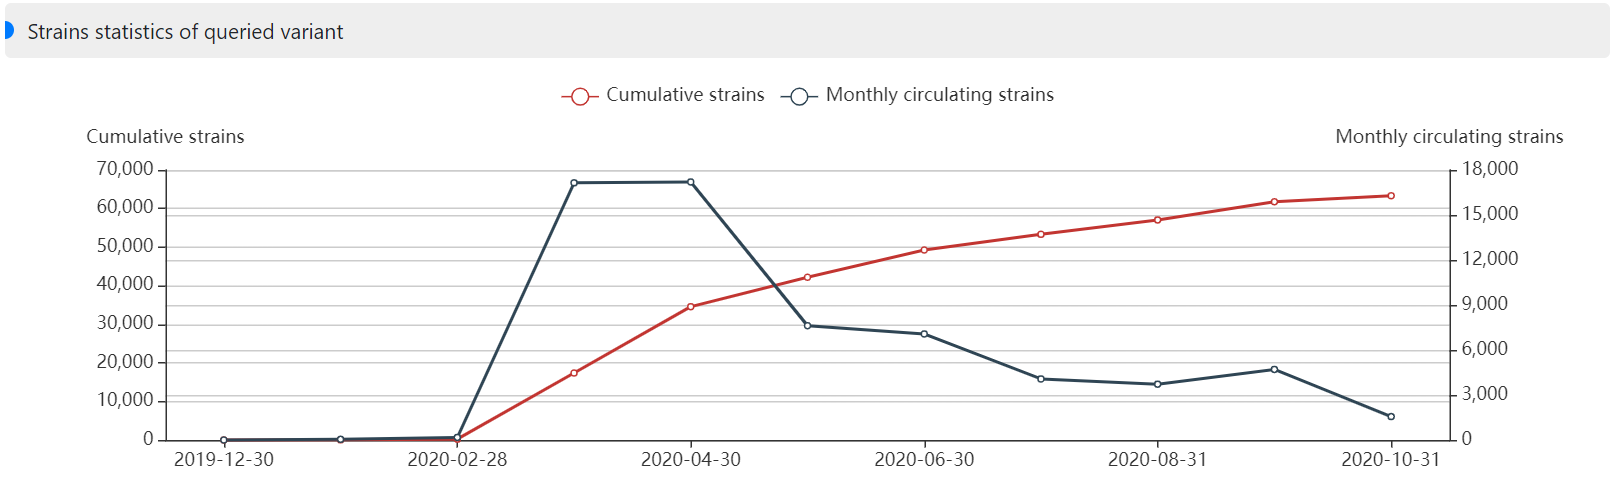
The cumulative strains and monthly circulating strains of the queried variant were
represented by red line and black line, respectively.